Education reform:
What changed this legislative session?
See the update
See the update

In many ways, 2025 has been a year like no other. Federal actions affecting the state have been fast and furious: freezing grants, eliminating housing supports, withholding or slashing food benefits and heating assistance, decimating healthcare access both by cutting Medicaid and ending enhanced insurance premium tax credits. All of this adds up to hundreds of millions of dollars in lost federal support, both to many individual Vermonters and to the state. The primary objective: to finance tax cuts for corporations and the rich.
These are not the only federal policies that have immediate, measurable consequences for the state. Causing unprecedented harm to the security and prosperity of Vermonters are the near elimination of global public health resources, the loss of critical data collection, layoffs of federal workers by the thousands, and a campaign of lawless, aggressive, and indiscriminate immigration enforcement.
At the same time, the story this report tells about Vermont is familiar:
The explanation from state leaders for why these problems are allowed to persist has been consistent too: The enemy is taxes—not hunger, homelessness, or poverty. Policymakers insist that the state cannot afford to invest in policies that can bring down costs for Vermonters and boost wages, even as the feds hand billions of dollars back to wealthy Vermonters in tax cuts.
Policymakers need to think much bigger to face the challenges ahead
The speed and scale of the federal actions are supercharging Vermont’s problems. The response will have to reckon with both the immediate harm and the ongoing challenges.
State leaders took some important actions to protect Vermonters this year. When the federal government held back critical food benefits in a frightening game of shutdown chicken this fall, Vermont stepped in to ensure recipients would not go hungry. State leaders have resisted some overreaches by the federal government, such as requests to share certain healthcare data and send the National Guard to other states. But policymakers need to think much bigger to face the challenges ahead. Solving Vermont’s problems requires more collective action and commitment than ever before.
Federal actions and policies are making Vermont’s problems harder to solve. But they’re also providing the opportunity to take matters into our own hands as a state by redirecting resources from tax cuts for the wealthy to investments that benefit us all. It’s up to Vermonters to push our leaders to do the right thing.
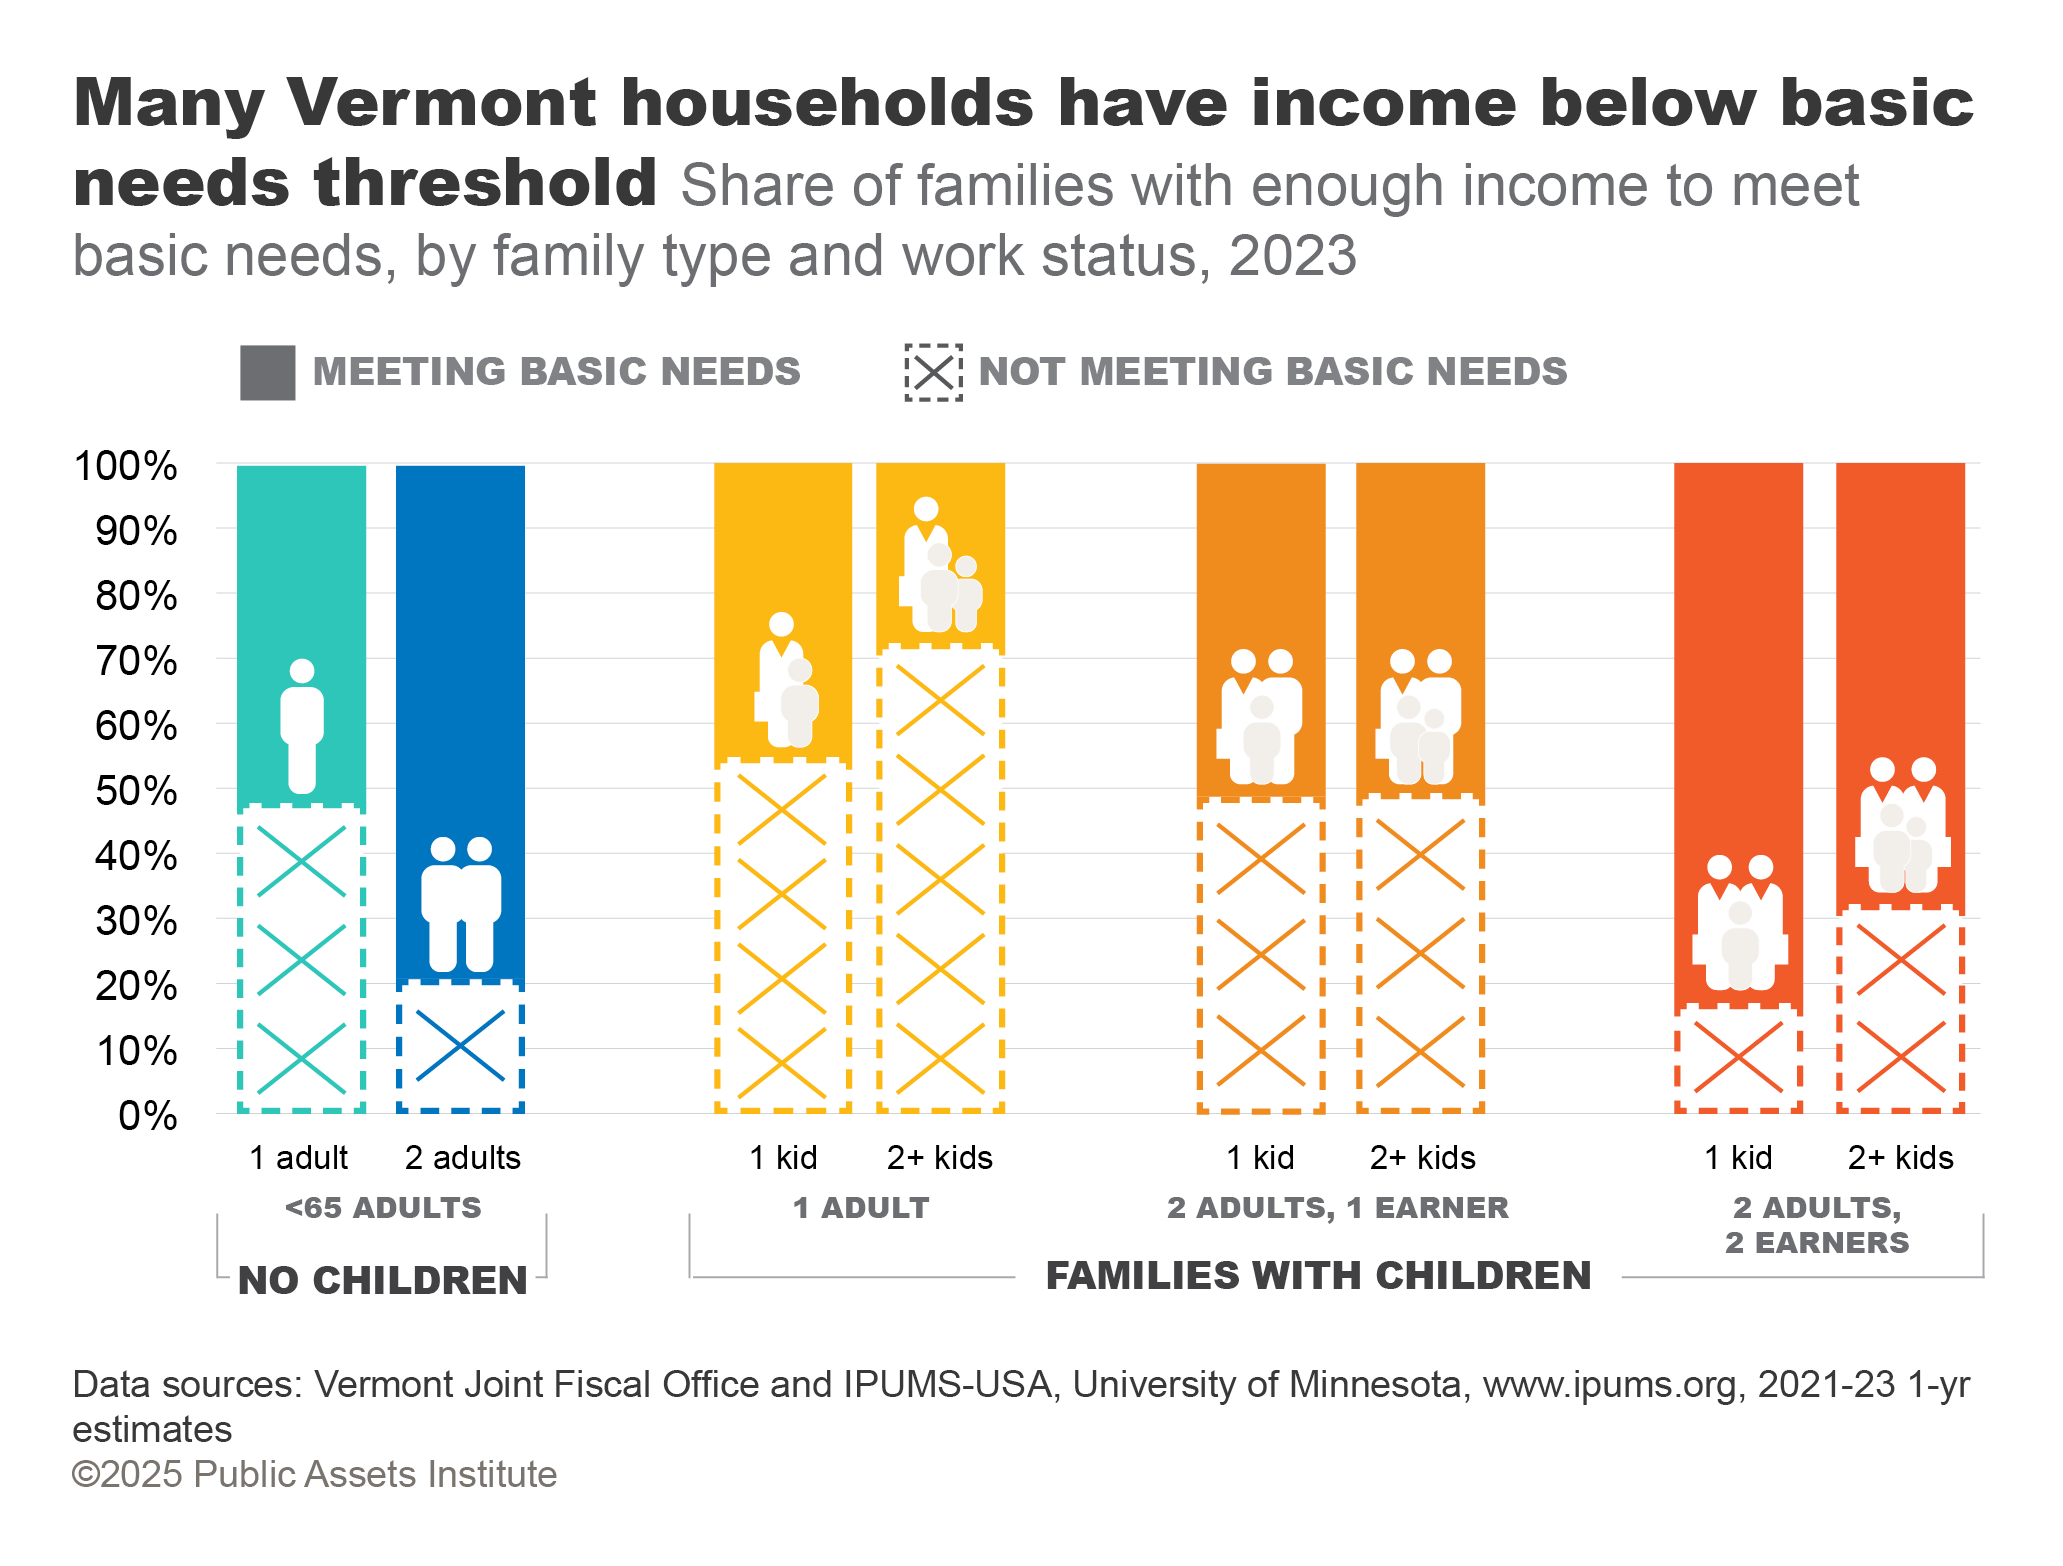
Basic needs include food, rent (typically lower than owner-occupied monthly costs), transportation, childcare, healthcare, and other household expenses. Vermont’s Legislative Joint Fiscal Office (JFO) calculates the income needed to cover all basic needs for households in Vermont, differentiated by family size and urban or rural areas. This analysis applies to taxpayers under 65 because expenses and taxes change for taxpayers 65 and over. Adults can be biological, foster, stepparents, or grandparents of children in the household.
Using JFO standards, Public Assets compared U.S. Census data on household income to the basic needs thresholds for various household types to determine the shares above and below the thresholds. The family types in the JFO report represent about 55 percent of Vermonters. This year, Public Assets expanded the analysis to include additional family types to represent 74 percent of Vermonters.
Many Vermonters’ incomes fall below the basic needs standard established by the state. The majority of one-adult households with children have income under the threshold, as well as nearly half of single adults without kids. In households with children where only one of the adults is working, half have income below the basic needs amount. Households with two earners fare better—a quarter of them are below the threshold. Families with kids have higher expenses, and households with more kids have more costs. Some households may be accessing other sources of financial support or sharing housing or expenses to make their budgets work. Still, many families are struggling to cover growing costs. The mismatch between income and need must be addressed.


The official poverty rate is the share of the population living below the federal poverty threshold, determined by family size. The U.S. Census Bureau tracks the poverty rate by many demographics, including age and race.
The official poverty rate for Vermonters overall was 9.0 percent in 2024, the third-lowest rate in the country and below the national rate of 12.1 percent. Those between 18 and 34 were more likely to live in poverty than other age groups. Nearly 12,000 Vermont seniors faced poverty, as well as 10,000 children.

In 2022, the top 10 percent of Vermonters held 45 percent of the total income in the state, leaving just 55 percent for the remaining 90 percent. The last time the top 10 percent held a comparable share was the 1930s, during the Great Depression and leading up to World War II. But for the last 50 years, the richest have accrued an increasing share of income.
Income inequality is the unequal distribution of incomes across the population of income tax filers. A large difference between those at the top and everyone else shows that prosperity is not being shared between owners or investors and the workers who contribute to increased productivity and wealth.

3SquaresVT provides food assistance to Vermonters with incomes up to 185 percent of federal poverty guidelines. Participants receive benefits through the federal Supplemental Nutrition Assistance Program (SNAP).
In any given month, over 60,000 Vermonters rely on benefits from the federal Supplementary Nutrition Assistance Program, or SNAP—also known as 3SquaresVT. This includes more than 18,000 children. All participants suffered delays in benefits in November 2025 because of the federal government shutdown. But the budget reconciliation act passed by Congress in July imposes significant cuts to SNAP over the long term. Federal policymakers are shifting costs to the states, eliminating numerous groups of people from eligibility, and imposing stricter work requirements for participation. Estimates vary, but anywhere from 16,000 to 40,000 Vermonters—as many as two-thirds of current recipients—risk losing some or all of their 3SquaresVT food assistance.

The point-in-time homeless count is a measure of the number of people living in emergency shelters, hotels, transitional housing, and places not meant for human habitation. It does not include households doubled up with family or friends. The figure is based on a census taken each year in one 24-hour period in January. Vermont housing organizations conduct the survey using methods established by the U.S. Department of Housing and Urban Development.
Since 2020, homelessess has risen sharply. A one-day point-in-time count last January found nearly 3,500 people in Vermont without permanent housing, more than triple the number in 2019, and one of the highest rates of homelessness of any state. And January is when the state makes the most shelter beds available; in warmer weather many more homeless Vermonters are unsheltered. Recent federal actions are exacerbating the problem, including efforts to criminalize unsheltered homelessness, potential cuts to homelessness assistance programs, and the elimination of access to housing vouchers for at least 131 Vermont households in 2025, with larger possible losses in 2026.

The middle value of a set of numbers or data points—half the figures fall below the median and half above.
Household income includes the income of all household members 15 years and older. Real median income has been adjusted for inflation.
Primary home sale prices reflect all sales in the state in a given year for homes designated as primary residences by the homebuyer on property transfer tax records.
The median value of primary homes in Vermont, as reported by the U.S. Census, jumped by over $119,000 between 2019 and 2024, from $233,200 to $352,800. That’s much larger growth than in the prior five years, when the increase was $18,000. The share of homes worth more than $300,000 in the state went from one-third in 2019 to nearly 60 percent in 2024. Primary homes for sale have followed suit. The median sale price increased by 55 percent over the period.
Meanwhile, household income has grown just 15 percent since 2019, failing to keep up with rising home prices. In 2019 Vermonters at the median income level could afford about half of homes in the state; by 2024 that share had dropped to a third. In other words, most Vermonters cannot afford most homes in the state. The U.S. Department of Housing and Urban Development defines unaffordable housing as costing more than 30 percent of household income.


The U.S. Department of Housing and Urban Development (HUD) determines Fair Market Rents (FMRs) for metropolitan and rural housing markets across the country. The FMR is typically set to give the renter access to 40 percent of standard-quality two-bedroom units in the given area, based on five-year American Community Survey data.
Two workers earning minimum wage will not be able to afford a standard two-bedroom apartment in the biggest metro areas in any New England state in 2026. In Vermont, the difference between their income and rent in 2026 will be more than $25,000 annually, or $6 more income hourly per earner. That’s both because the Vermont minimum wage has fallen behind the other states (except New Hampshire, where the wage is tied to the federal minimum wage) and because rents have risen. In the last five years the median rent has increased by 35 percent, more than $300 per month. More than 40 percent of units cost over $1,500 per month in 2024, compared with 15 percent in 2019.


While energy costs have come down from their 2022 peak, they’re higher than in 2021. A Vermont household with two vehicles and using fuel oil to heat their home spent over $1,200 more in 2024 than in 2021. The volatility in energy prices, particularly for fossil fuels, makes it hard for Vermonters to predict their bills from month to month and year to year. Changing federal policies, such as weakening efficiency standards and the ending of tax credits for electric vehicles, as well as the elimination of many grants for climate infrastructure, make it harder to invest in sustainable and more durably affordable energy.


Federal policy changes will make healthcare more expensive or entirely unaffordable for thousands of Vermonters. More than 30,000 Vermonters get health coverage on the state’s Affordable Care Act exchange, most with help from federal tax credits, which reduced Vermonters’ insurance premiums by $350 million in 2025. Of that, $65 million came from the enhanced premium tax credits set to expire at the end of 2025. Vermont has some of the highest healthcare costs in the country, and the loss of those credits will likely put health insurance out of reach for many Vermonters.


In addition to the pending loss of the enhanced tax credits, states are facing significant cuts to Medicaid under the reconciliation bill Congress passed in July, amounting to the loss of hundreds of millions of federal dollars to Vermont’s budget each year. More than 170,000 Vermonters across the state are covered through Medicaid, and estimates suggest 10 percent could lose healthcare.
Medicaid is a publicly funded federal program available to low-income people and those meeting other eligibility criteria. The Children’s Health Insurance Program (CHIP) and Medicaid coverage for children—known as Dr. Dynasaur in Vermont—provide low-cost or free health coverage for children and teenagers under 19.

EMPLOYMENT: The number of people working, including farmworkers and the self-employed.
UNEMPLOYMENT: The number of people who are not working and actively looking for work.
LABOR FORCE PARTICIPATION RATE: The labor force comprises both employed and unemployed people. The labor force participation rate is the percentage of working-age people (16 and over) who are in the labor force. The U.S. Bureau of Labor Statistics (BLS) calculates the rate for different demographics, including age, race, and sex.
Vermont’s total labor force has returned to its pre-Covid baseline. Roughly the same share of Vermonters, across age groups, are participating in the workforce as in 2019. More Vermonters are unemployed than in 2019, but the joblessness rate remained low, at under 3 percent in September 2025. More recent state jobs data were delayed because of the federal government shutdown. Some workers are experiencing more job uncertainty this year: The state’s roughly 6,600 federal workers—1.9 percent of the total workforce—remain at risk of layoff.


Vermont is one of only four states where the number of jobs has not returned to pre-Covid levels. In August 2025, there were 2,400 fewer jobs in the state than in January 2020 and nearly 5,000 fewer than the record set in March 2019.

The number of total nonfarm jobs is estimated through the Current Employment Statistics (CES) program, a monthly survey of employers conducted by the U.S. Bureau of Labor Statistics with the Vermont Department of Labor. This is the number of jobs currently filled, not the number of workers. One worker can hold multiple jobs.

After a decade of stagnation, beginning in 2014 real median household income has grown in Vermont and the rest of New England. Adjusted for inflation, Vermont’s household income was nearly $83,000 in 2024, up from $72,000 a decade earlier. But most of the growth occurred in the first half of that period: Connecticut, Massachusetts, and Rhode Island have lost ground since 2019, while growth in the other states has slowed. The U.S. as a whole saw faster growth over the period, but most of it came between 2014 and 2019.
Median household income is the middle amount of annual income—half of Vermont households receive more than the median and half receive less. Household income includes the income of all household members 15 years and older. Real median income has been adjusted for inflation.
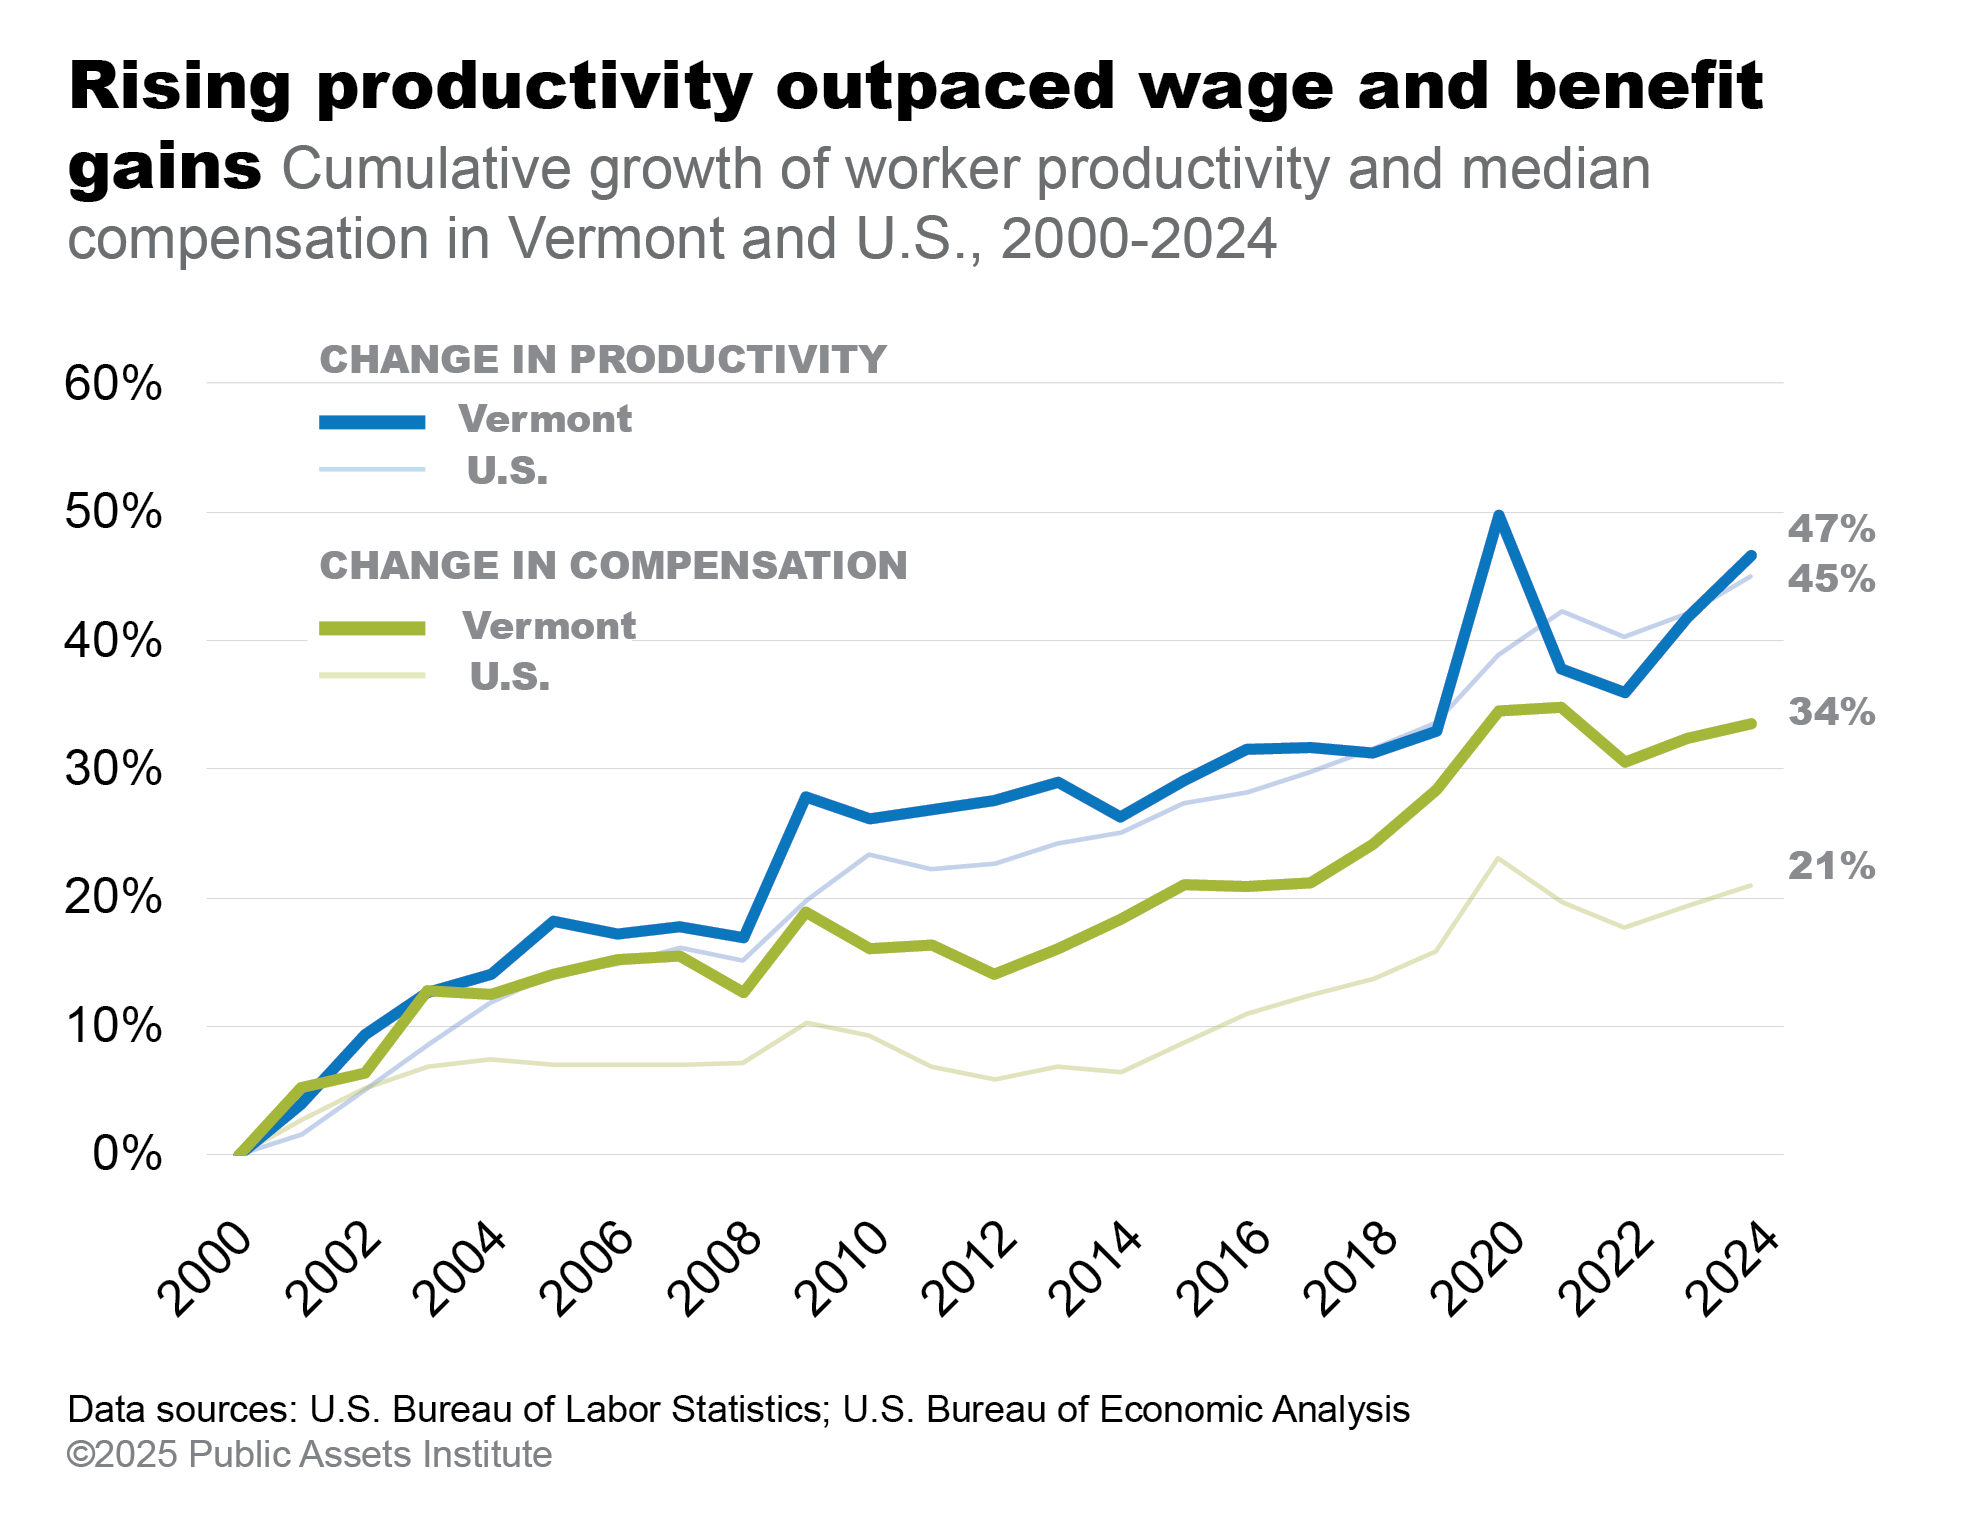
WORKER COMPENSATION: Median hourly wage and benefits for production and nonsupervisory workers.
WORKER PRODUCTIVITY: Total income generated in the economy per average hour of work.
Most Vermont workers’ pay has not kept pace with the growth of their output. From 2000 to 2024, productivity grew 47 percent in Vermont. But compensation for production and nonsupervisory workers, who make up about 80 percent of the workforce, rose by just 34 percent. Vermont is doing better than many other states: U.S. productivity grew 45 percent from 2000 to 2024, but compensation grew less than half as fast nationally—only 21 percent. As a recent report by the Economic Policy Institute explains, the gap between compensation and productivity has widened in recent decades because more of the gains have flowed to corporate profits, executives, and shareholders. If wages had kept up with productivity over the last 25 years, Vermont workers would be making $3.12 more per hour—or $6,500 per year—than they are.

While real hourly wages have grown faster at the bottom over the last decade, the increase doesn’t add up to as big a gain in dollars as that at the top. Gains for the 90th percentile yielded an additional $18,000 per year, while those at the bottom brought in a third as much.
Percentile wages are calculated by ranking the hourly wages of full-time workers and dividing them into equal-size groups. The 10th-percentile wage is the highest wage paid to the bottom 10 percent of workers, the 20th-percentile wage is the highest wage paid to the bottom 20 percent, and so on. The 50th-percentile wage is the median wage, meaning that half of all workers are paid less than that amount and half are paid more.

Vermont’s state and local tax system is less regressive than most states’, but middle-income Vermonters still pay a bigger share in taxes than the richest. Vermonters pay taxes in three big categories: on income, consumption, and property. The state income tax is progressive (higher-income Vermonters pay a bigger share of their income), while the sales tax is regressive—it takes a bigger bite out of lower-income people’s budgets. Property taxes are progressive up to the middle level of income and become regressive at the high end.
 It’s getting harder for Vermonters to make ends meet. That’s both a cost problem and a wage problem: The costs of basics like housing, fuel, and groceries are growing faster than wages, and workers are keeping less of what they’re generating. In short, wages aren’t keeping up with the growth in economic output.
The actions of the federal government this year have exacerbated many of the problems already facing Vermonters. But the state has the capacity for changes on both sides of the cost-wage equation to make Vermont affordable for all.
The federal cuts to government benefits and services financed bigger tax breaks for the wealthiest Americans. The One Big Beautiful Bill Act (OBBBA) passed in July permanently extended and expanded many of the tax cuts from the Tax Cuts and Jobs Act of 2017. These new cuts will provide over $700 million in tax savings each year to the richest 20 percent of Vermonters. The top 1 percent will save an annual average of nearly $60,000, twice the earnings of a Vermonter working full time for minimum wage.
Even before these latest tax cuts, income inequality was growing in Vermont. The top 10 percent of Vermont tax filers receive a much bigger share of income in the state than they did 50 years ago. That leaves less for the other 90 percent, many of them struggling to keep up with the costs of necessities.
Recouping just some of that $700 million in federal tax breaks to the wealthiest would allow the state to hold the line on programs that help Vermonters, including Medicaid, SNAP, and healthcare tax credits. The state could start to turn the tide on housing by investing in building more units, ensuring that more homes are permanently affordable, and shoring up supportive housing.
The federal cuts are drastic, and the consequences are clear: harm to the most vulnerable to make the rich richer. That should be more than enough reason for Vermont policymakers to act.