Education reform:
What changed this legislative session?
See the update
See the update

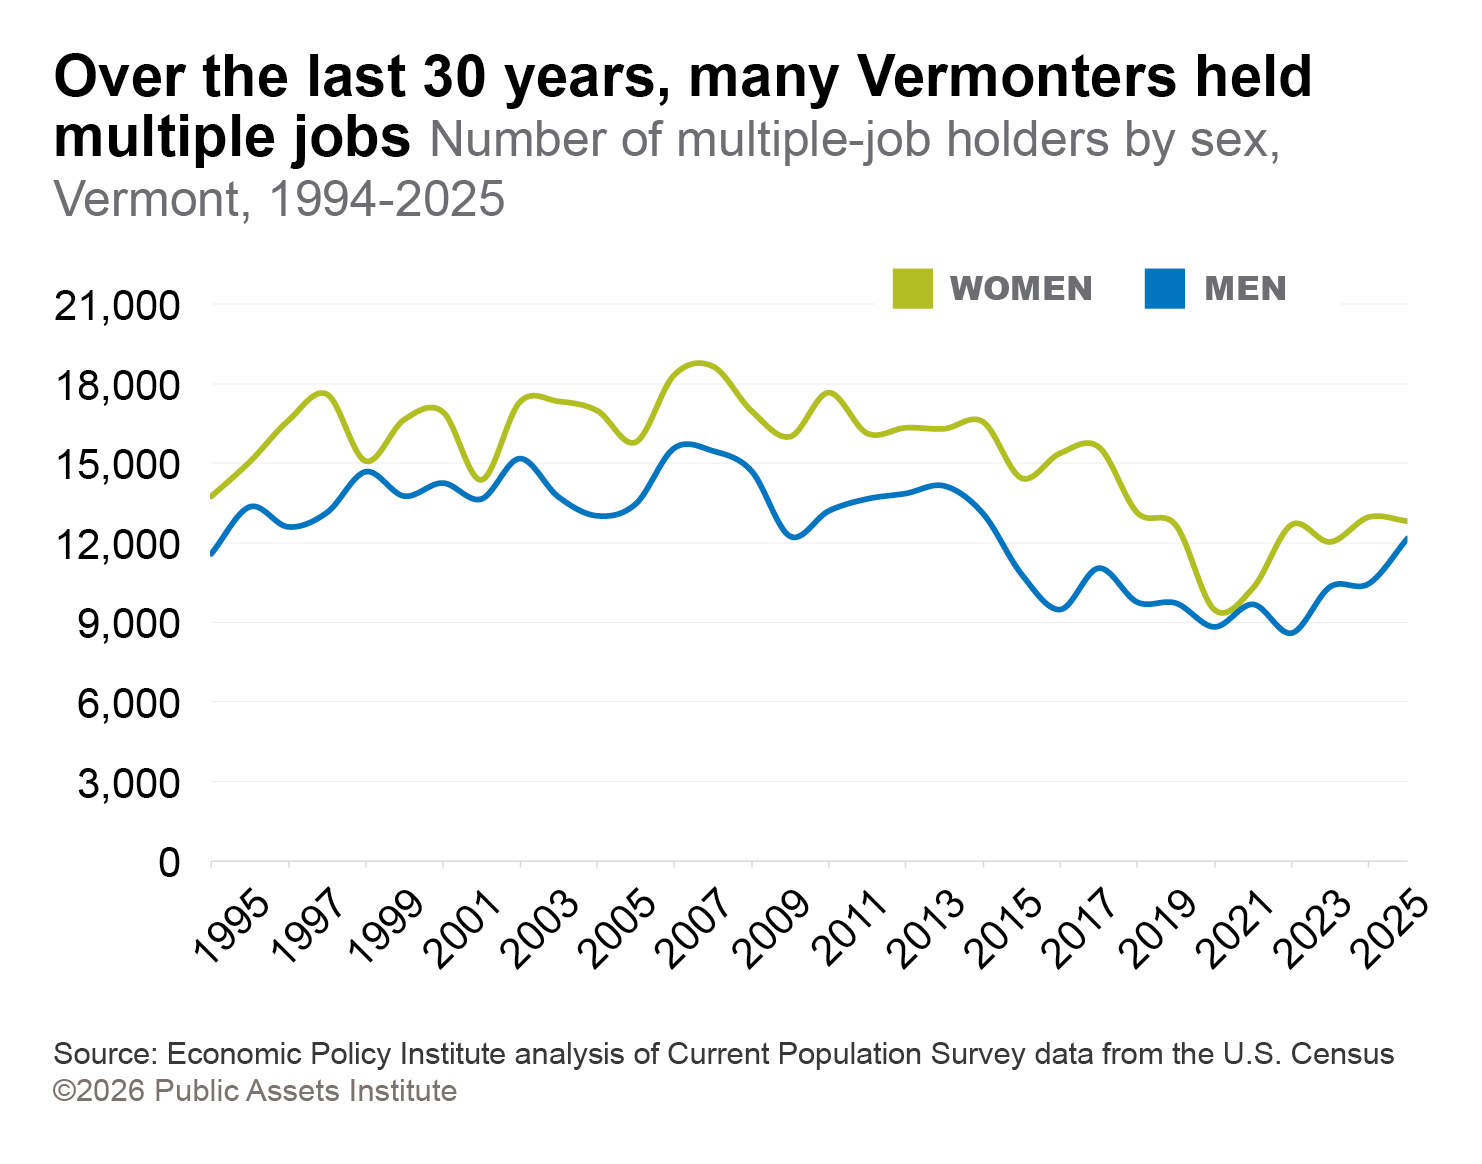
For each of the past 30 years, more Vermont women than men have held multiple jobs at once. The total number of people working several jobs peaked in 2007, with nearly 19,000 women holding more than one job, compared with about 15,000 men. Since then, the total number of Vermont workers with multiple jobs has declined, and the difference by sex has narrowed.
Despite this decline, nearly 7.5 percent of the total Vermont workforce still juggled more than one job last year. This was higher than the national rate of 5.5 percent. Only 10 states had a higher share of multi-job workers than Vermont, and none were in New England. Kansas had the highest share, with more than 9 percent of its workforce holding more than one job.
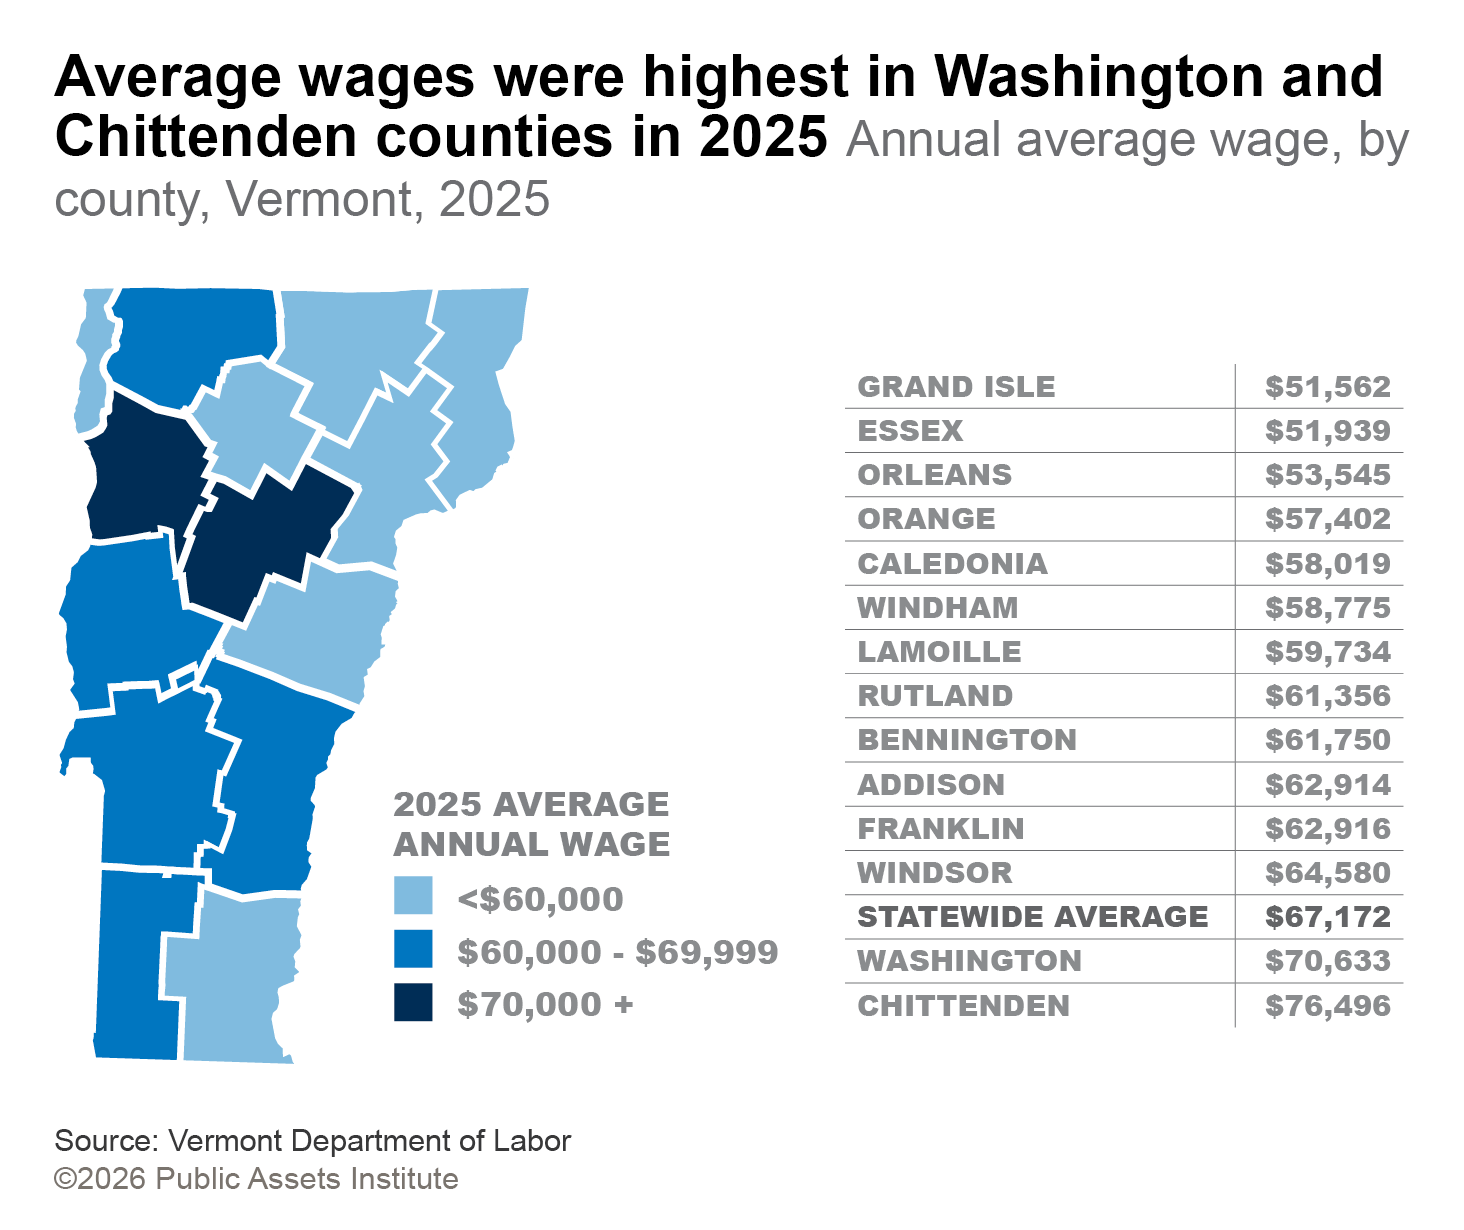
Vermont’s average wage in 2025 was $67,164 annually, well below the U.S. average of $78,722. Most states’ averages fell below the national because a handful of higher-wage states drove up that number.
All of Vermont counties’ average wages also came in below the national average. But two, those of Chittenden and Washington, were above the state’s average. Grand Isle and Essex had the lowest wages, below $52,000, with Grand Isle ranking among Vermont counties showing the fastest growth over the last decade and Essex among the slowest. Across the U.S., counties’ average annual wages varied from less than $34,000 in parts of Nebraska and Missouri to over $200,000 in California.
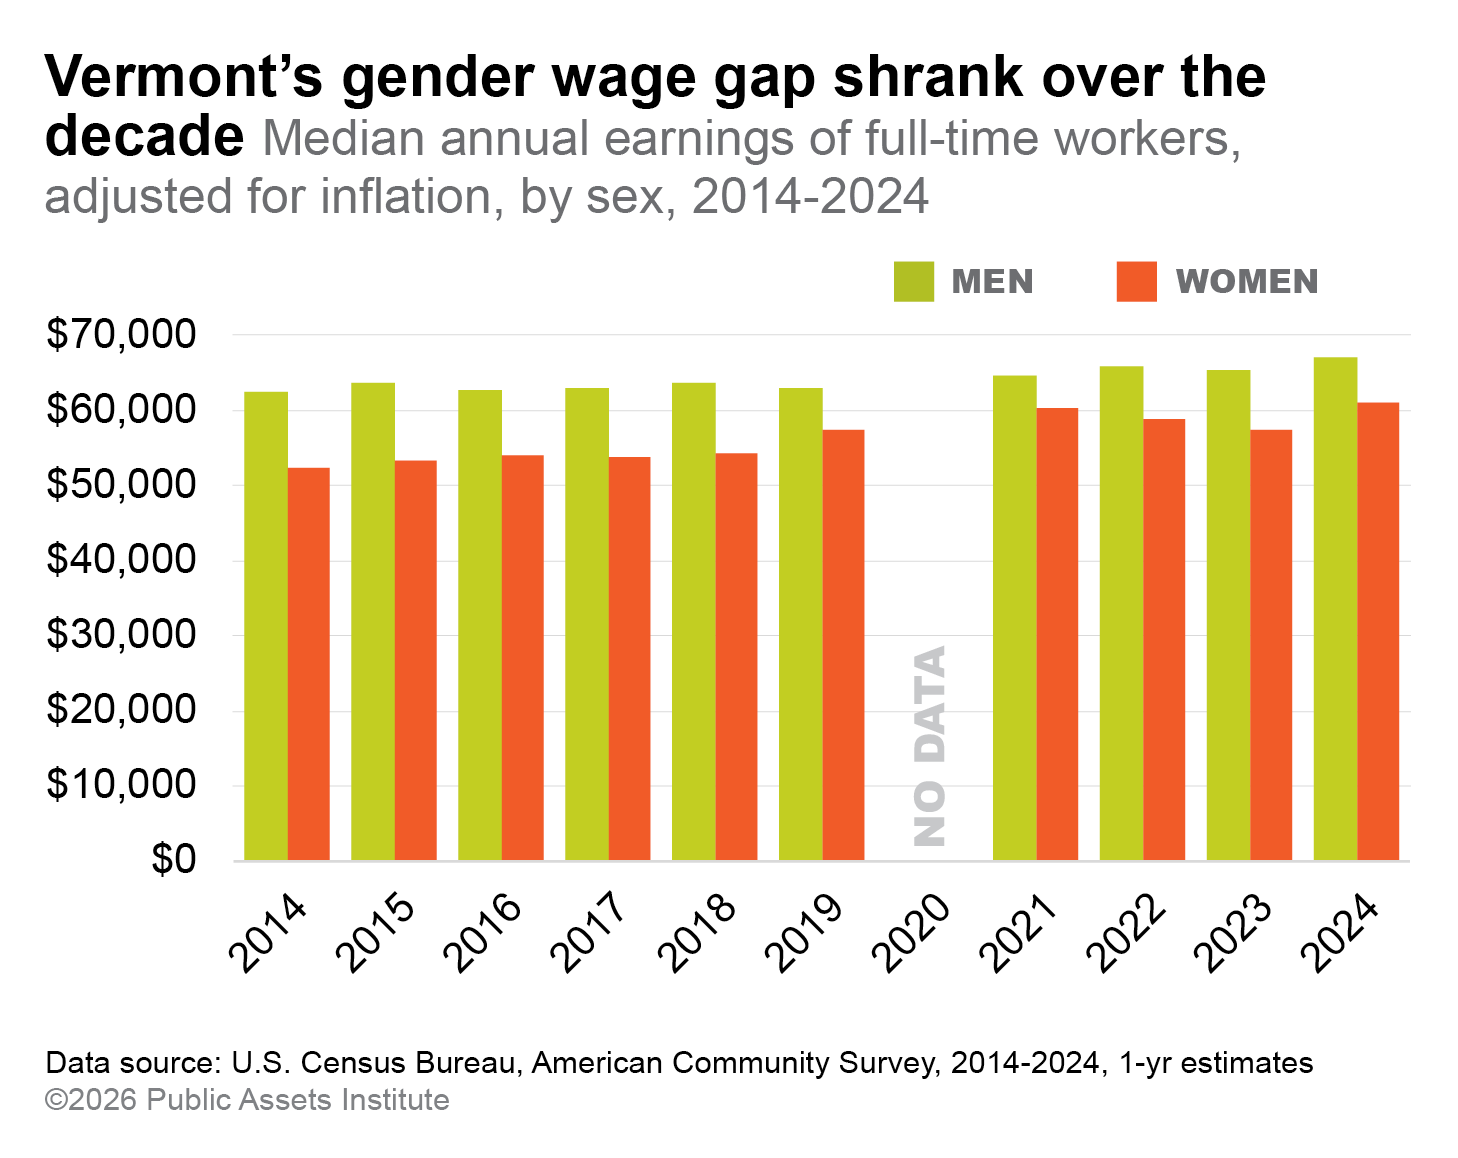
Progress toward gender wage equality is slowing
Over the last decade, Vermont narrowed the gender wage gap. From 2014 through 2021, women’s median wage grew at 3.5 times the rate of men’s, closing the gap from 16 cents to just 7 cents per dollar.
But between 2021 and 2024, that trend reversed. Men’s wages grew four times as quickly as women’s over that period. In 2024, women working full time earned $61,000 annually, compared with $67,000 for men.
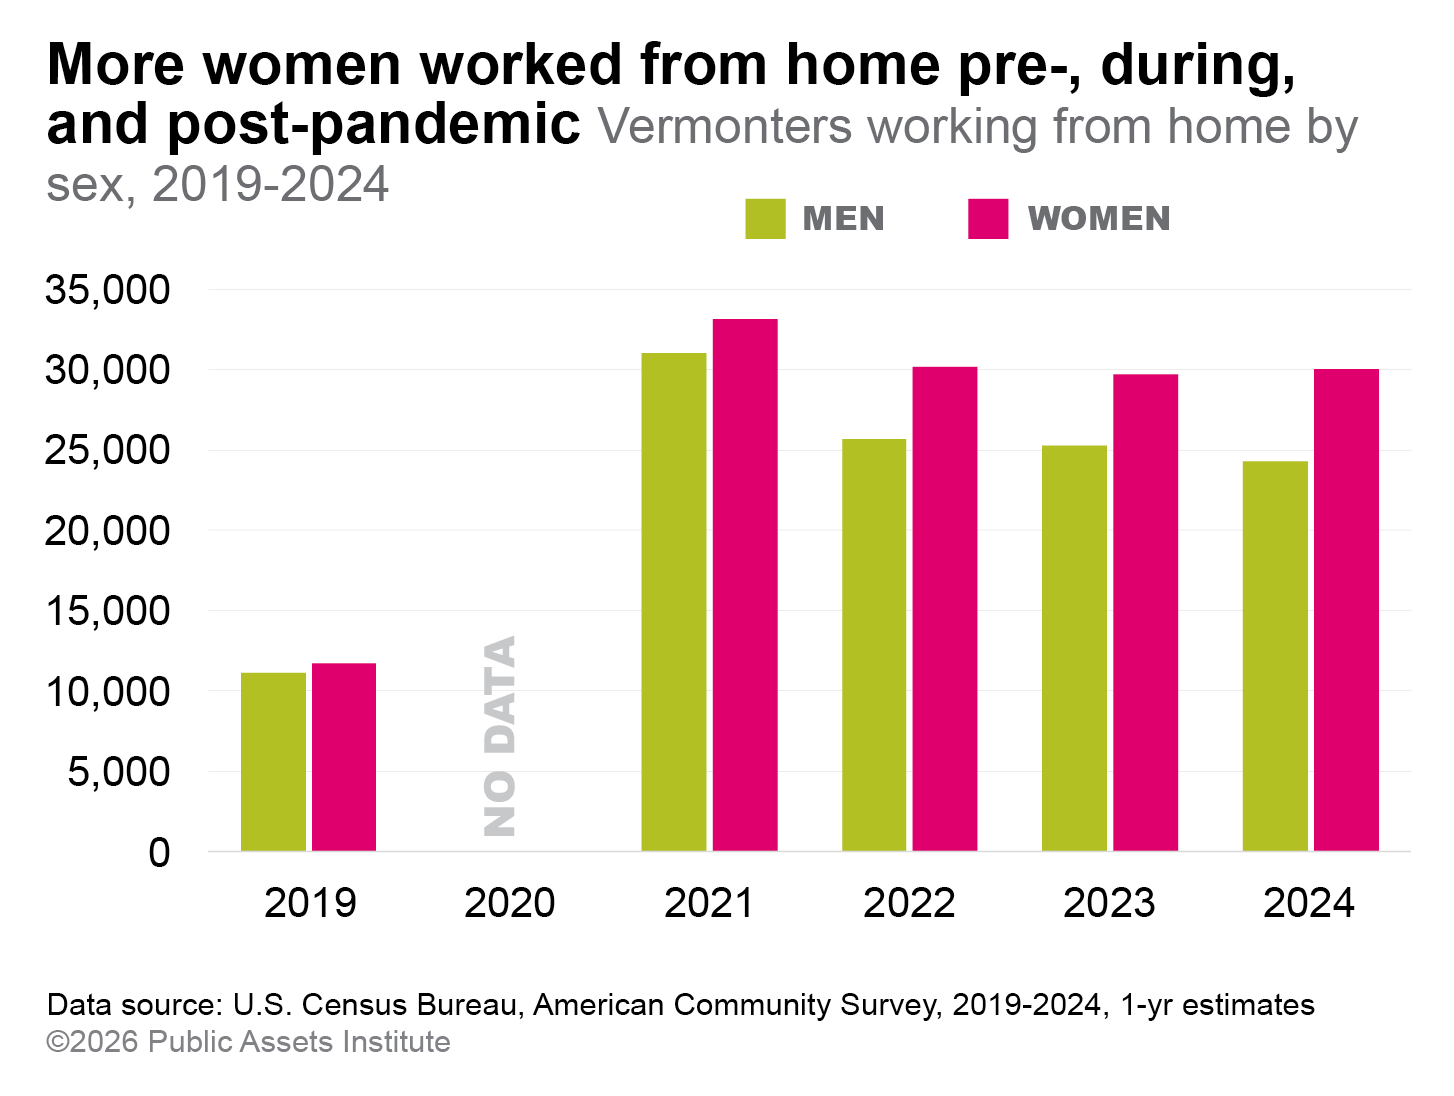
Before the Covid pandemic, the numbers of Vermont men and women working remotely were roughly the same. This is according to the U.S. Census, which asked how workers usually got to work the week prior to answering the survey. During the pandemic, the number of both men and women working from home tripled. But after Covid’s peak, as telework declined a gender disparity emerged.
From 2021 to 2024, more men than women returned to the office—6,700 compared with 3,100. Still, many more workers continued to work from home than did so before the pandemic.
Overall, about 18 percent of women and 14 percent of men in the Vermont workforce telecommuted in 2024.
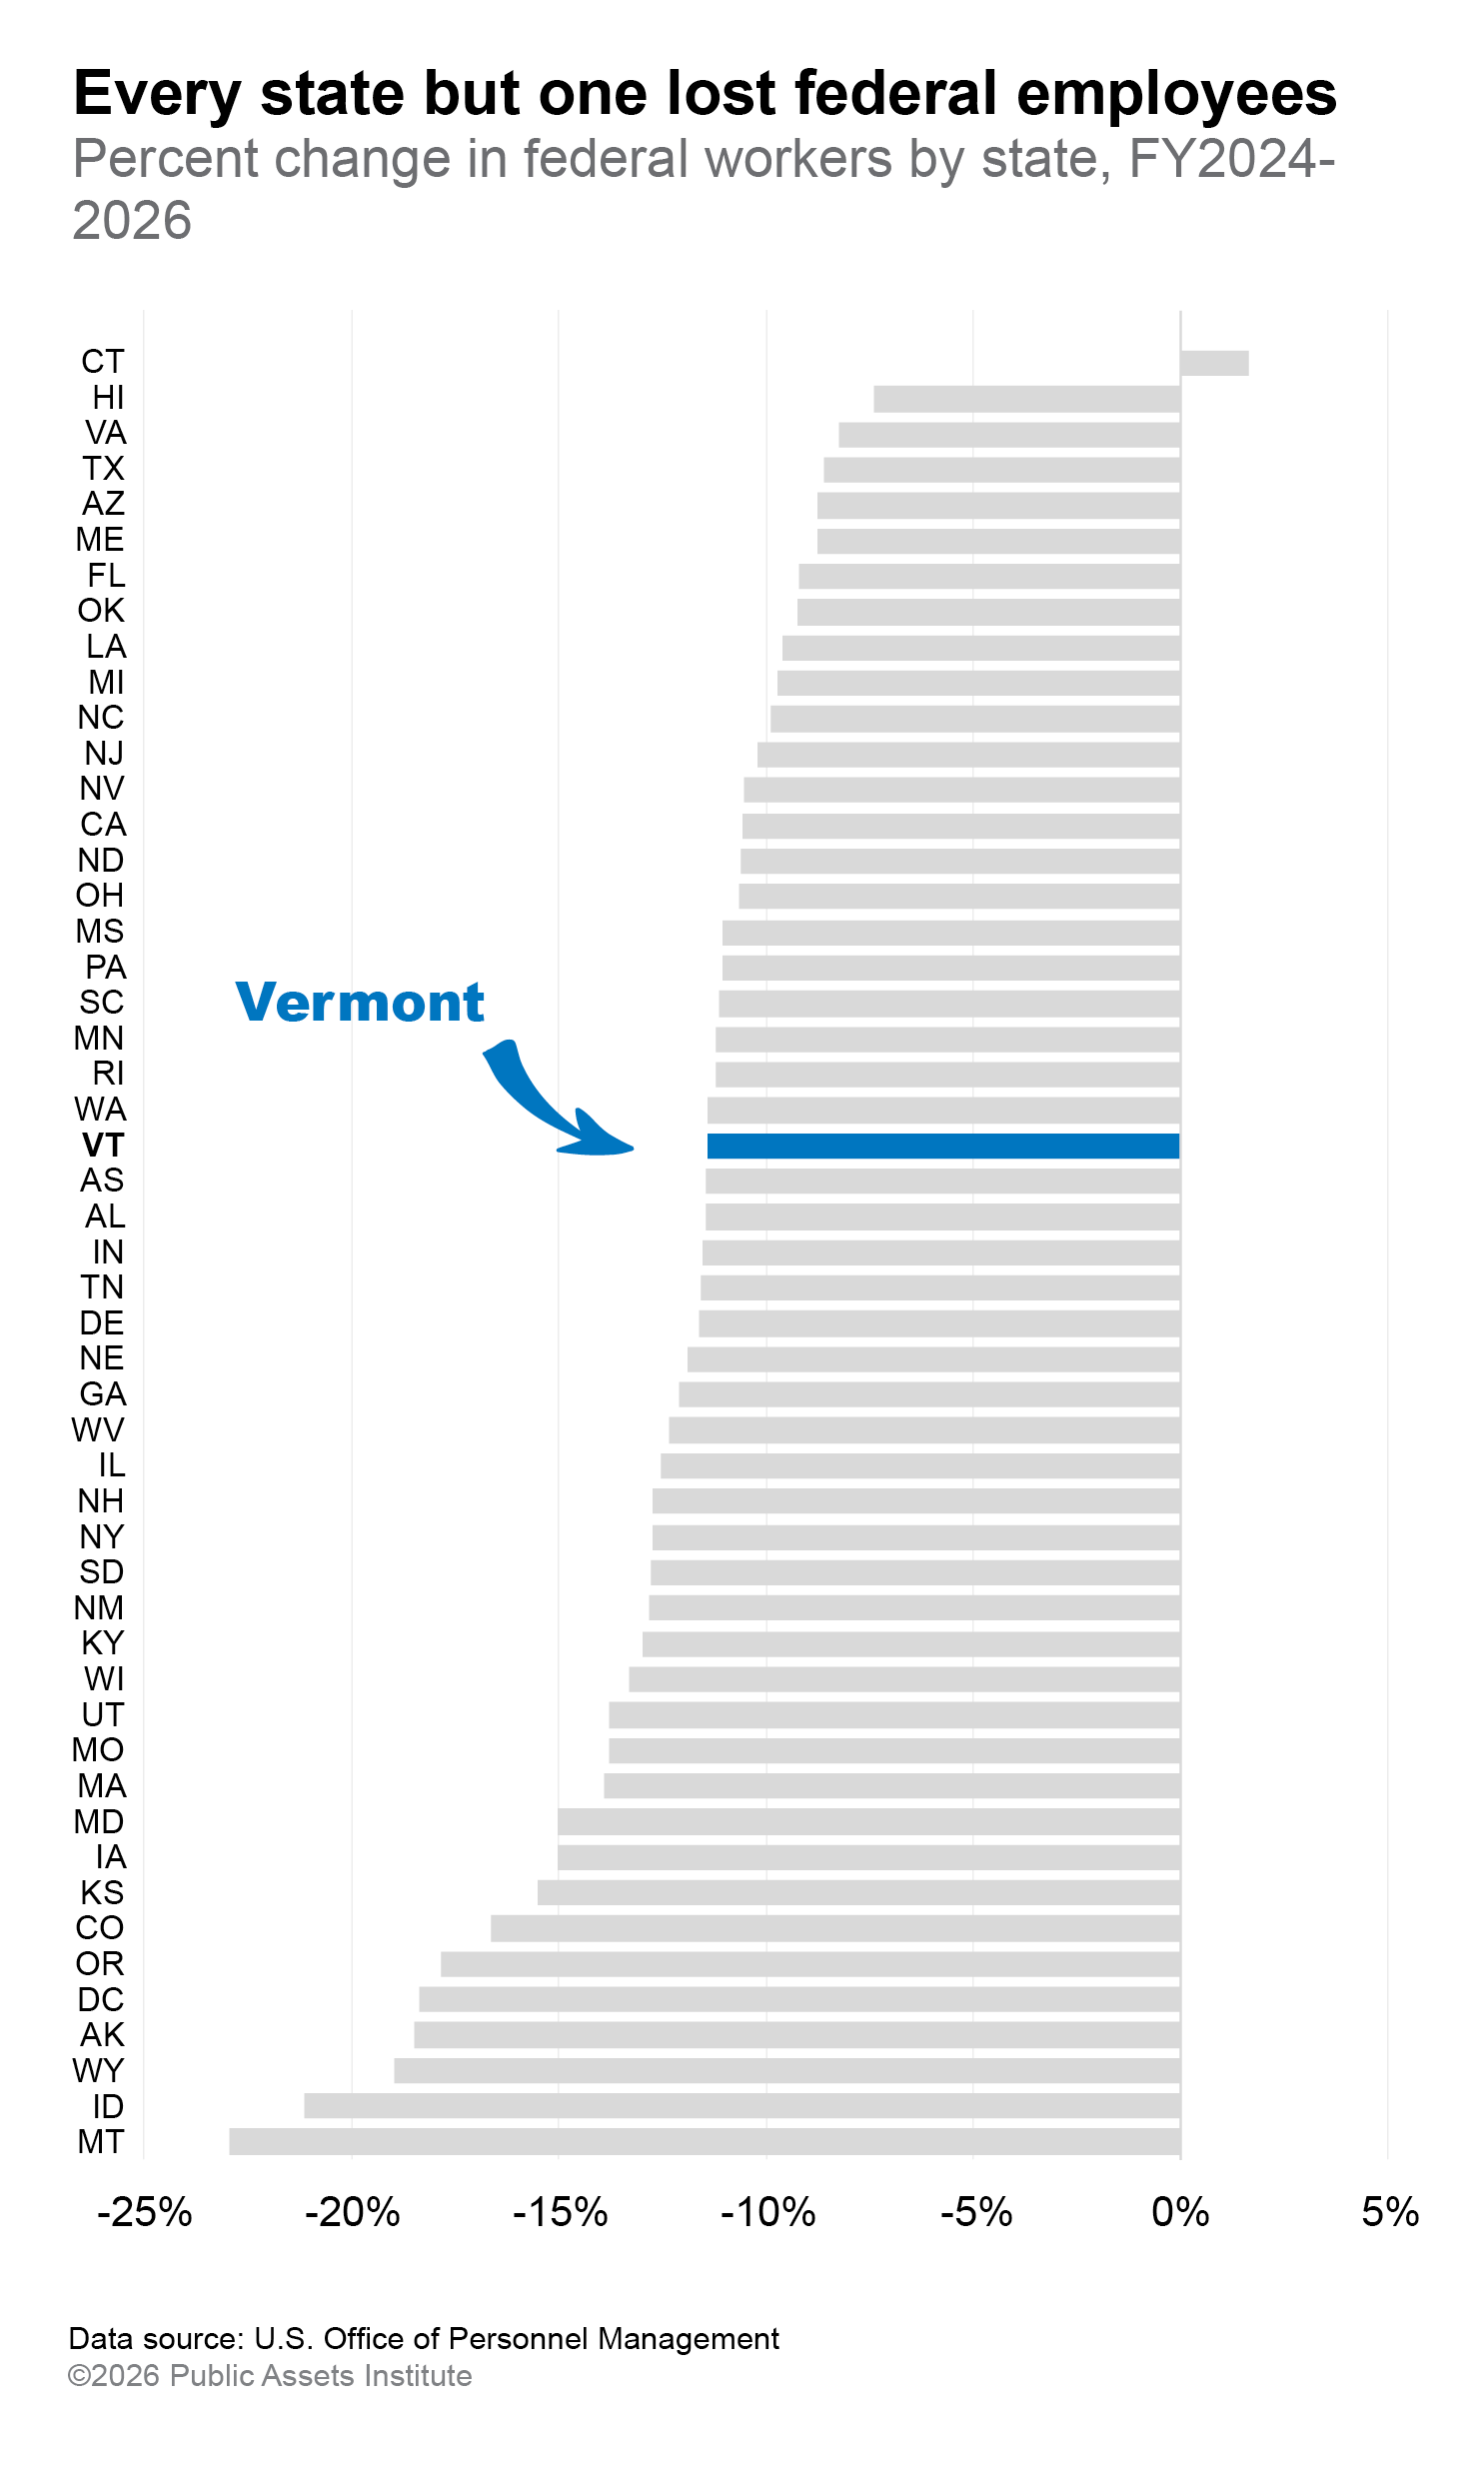
Vermont’s federal workforce decreased by over 600 workers—or 11 percent—between the end of the fiscal year in September 2024 and February 2026. This count includes personnel at federal agencies but excludes the U.S. Postal Service. It is the lowest number of federal employees in at least 10 years.
Vermont’s rate of decline is slightly lower than the country’s as a whole. Washington D.C. and Western states such as Idaho, Montana, and Wyoming saw losses closer to 20 percent over the period.
These departures were a mix of mass layoffs, incentivized retirements, and resignations under the pressures of the second Trump administration, including record-breaking shutdowns during which many federal employees have worked without pay.
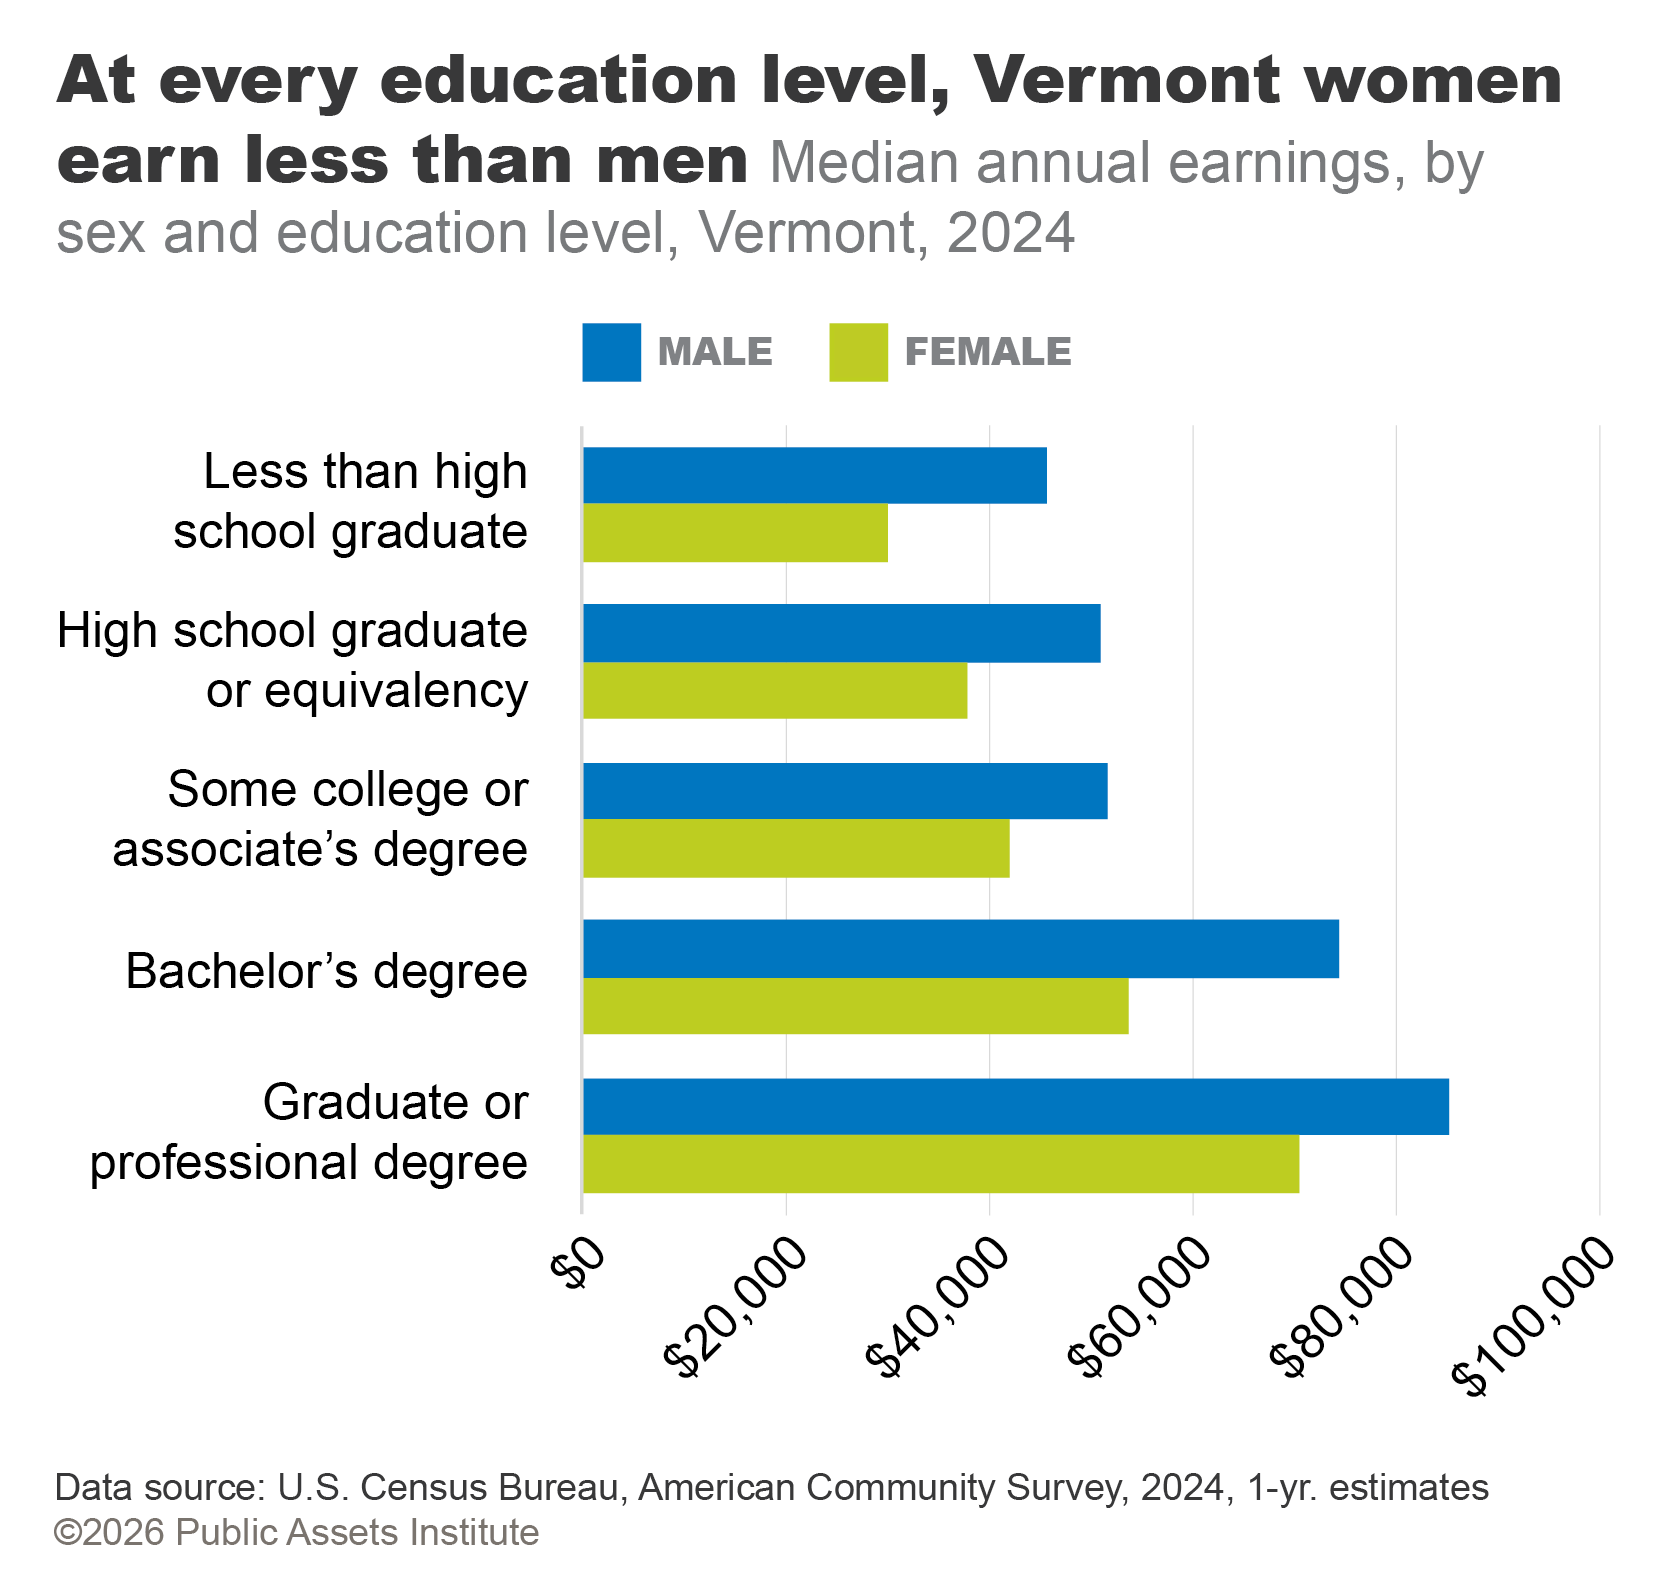
March 26th is National Women’s Equal Pay Day. Vermont’s pay gap has been consistently one of the smallest in the country, but at every education level, Vermont women earn less than men.
The Economic Policy Institute has a deeper dive on the wage gap, how it’s worse for Black, Hispanic, and Native American women, how federal actions over the past year have exacerbated it, and what states can do in response. Vermont Works for Women and the Vermont Women’s Fund put out a Vermont-specific mini-report on the wage gap at the end of last year that has more detail on its impact on Vermont women over their lifetimes. Both are worth a look.
While this is not a comprehensive picture of everything in the 2025 federalreconciliation bill, these are some of the biggest impacts. Vermont will pay $1billion less in federal taxes each year, with $440 million going to the top 5%.Meanwhile, Vermonters are facing cuts to critical services like food assistance,healthcare and housing.
Vermont’s migration trend last year continued a multi-decade pattern: international gains and domestic losses. Each year from 2005 to 2025, more people from abroad moved into the state than Vermonters left for other countries. Within the U.S., more Vermonters moved to other states than people in other states relocated to Vermont, resulting in net losses from domestic migration for 18 of the past 21 years. An outlier was 2021, during the pandemic, with a surge of nearly 5,000 people coming to Vermont through domestic migration. On average over the rest of the period, the state lost 800 people annually to other states. The international migration gains have helped offset these losses, contributing to net positive overall migration during this time.
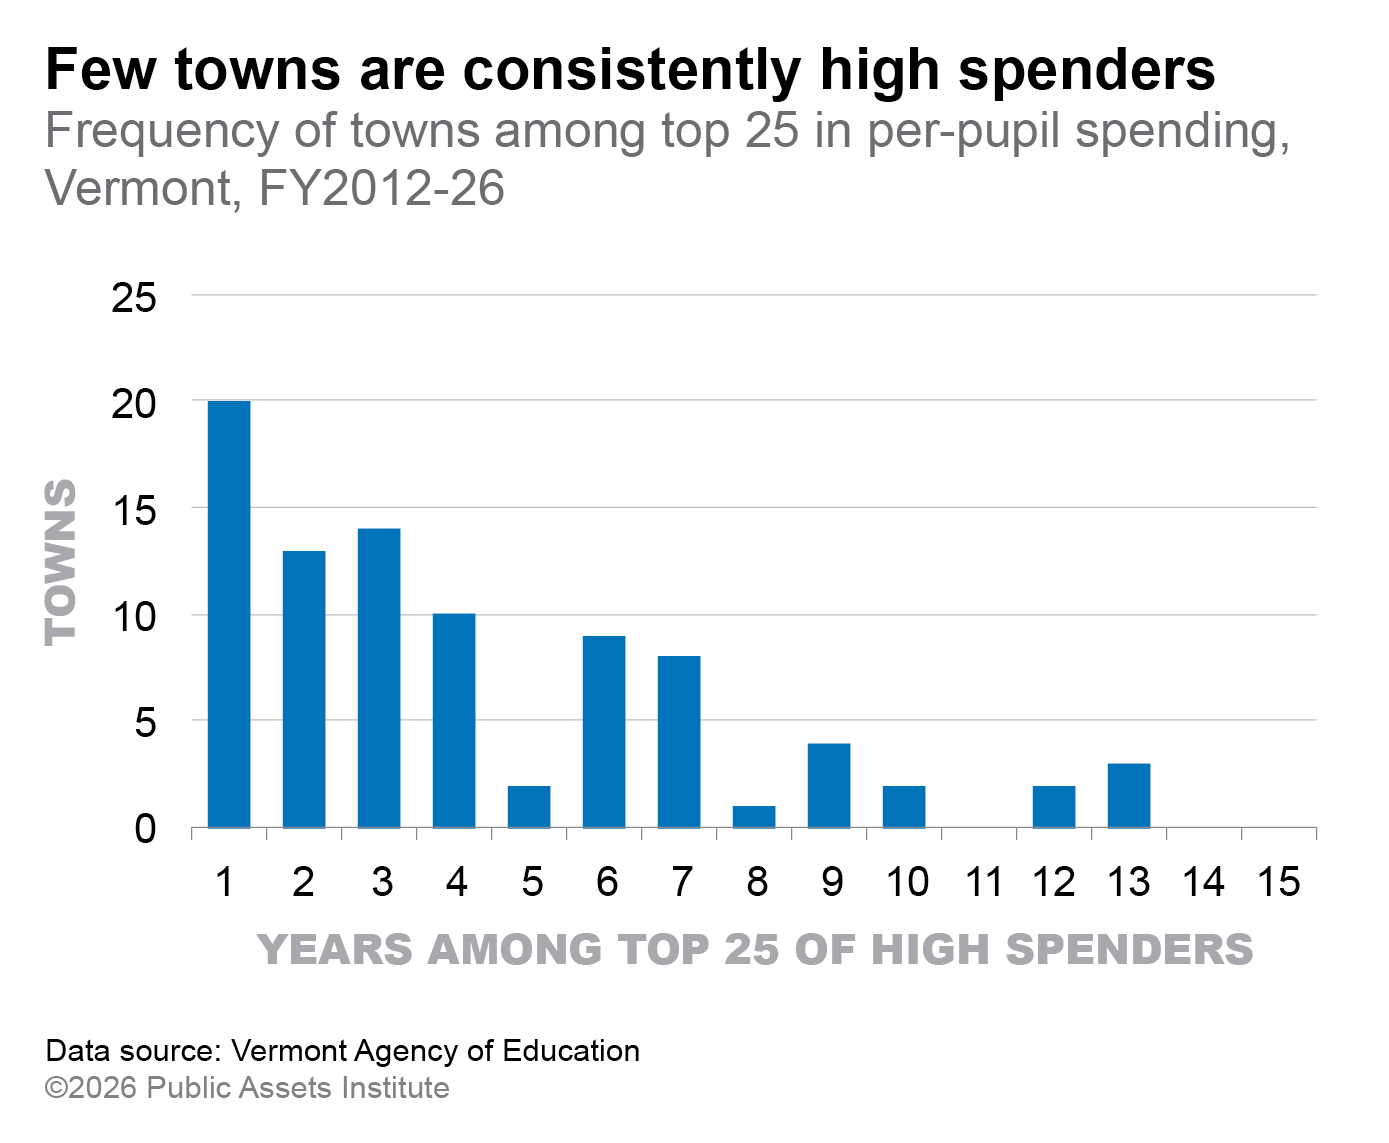
Vermont tried spending caps before. One problem with going after the high spenders is that few towns are consistently at the top of the list. For example, between fiscal 2012 and fiscal 2026, 88 different towns made the top 25 list. Fewer than half of those towns appeared on the list more than three times over those 15 years. And those towns account for fewer than 10 percent of Vermont students.
After years of steady growth, the number of Vermonters working fell below pre-pandemic levels in late 2025.
It took more than three years for Vermont employment to return to normal in the wake of Covid. By early 2024, the number of Vermonters working exceeded the number employed before the crisis. Monthly employment reached an all-time high in January 2025, at 348,340. Then it dropped every month through November.
Employment is a count of individuals who are working, including those who are self-employed. The number of people working is different from the count of jobs. For example, one individual can hold more than one job. While the number of working Vermonters dropped in 2025, employers did increase the number of jobs between December 2024 and November 2025. Still, Vermont has not recovered the jobs lost during the pandemic.
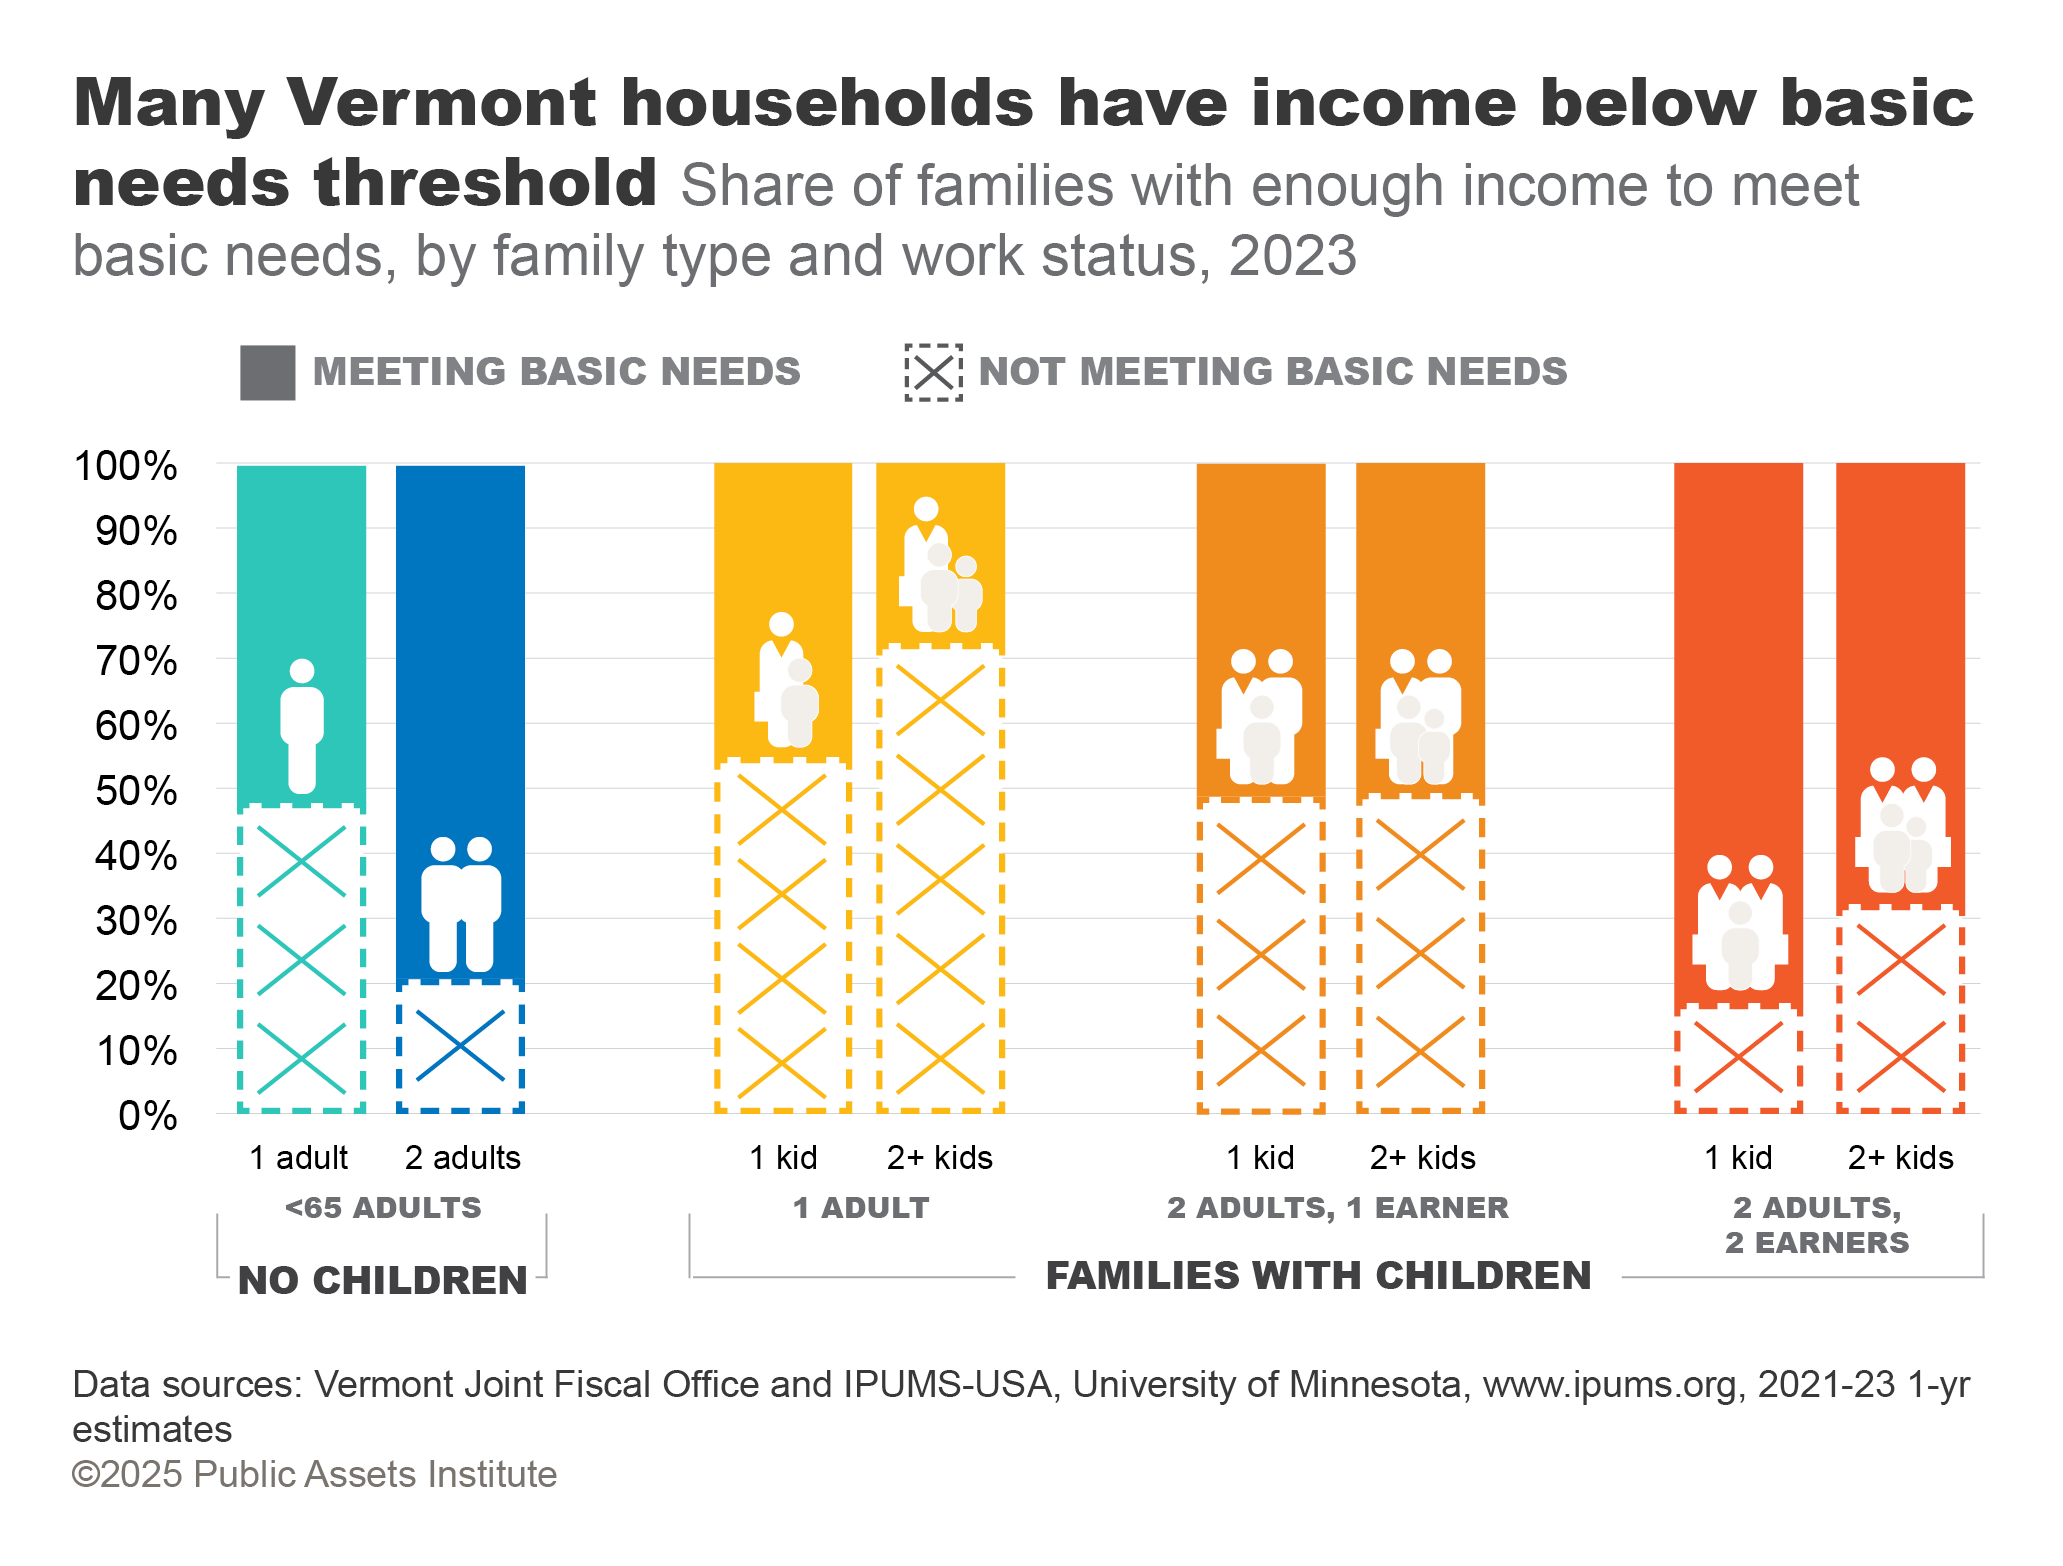
Many Vermonters’ incomes fall below the basic needs standard established by the state. The majority of one-adult households with children have income under the threshold, as well as nearly half of single adults without kids. In households with children where only one of the adults is working, half have income below the basic needs amount. Households with two earners fare better—a quarter of them are below the threshold. Families with kids have higher expenses, and households with more kids have more costs. Some households may be accessing other sources of financial support or sharing housing or expenses to make their budgets work. Still, many families are struggling to cover growing costs. The mismatch between income and need must be addressed.
A quarter of Vermont households have children at home
The official poverty rate for Vermonters overall was 9.0 percent in 2024, the third-lowest rate in the country and below the national rate of 12.1 percent. Those between 18 and 34 were more likely to live in poverty than other age groups. Nearly 12,000 Vermont seniors faced poverty, as well as 10,000 children.
In 2022, the top 10 percent of Vermonters held 45 percent of the total income in the state, leaving just 55 percent for the remaining 90 percent. The last time the top 10 percent held a comparable share was the 1930s, during the Great Depression and leading up to World War II. But for the last 50 years, the richest have accrued an increasing share of income.
In any given month, over 60,000 Vermonters rely on benefits from the federal Supplementary Nutrition Assistance Program, or SNAP—also known as 3SquaresVT. This includes more than 18,000 children. All participants suffered delays in benefits in November 2025 because of the federal government shutdown. But the budget reconciliation act passed by Congress in July imposes significant cuts to SNAP over the long term. Federal policymakers are shifting costs to the states, eliminating numerous groups of people from eligibility, and imposing stricter work requirements for participation. Estimates vary, but anywhere from 16,000 to 40,000 Vermonters—as many as two-thirds of current recipients—risk losing some or all of their 3SquaresVT food assistance.
Since 2020, homelessess has risen sharply. A one-day point-in-time count last January found nearly 3,500 people in Vermont without permanent housing, more than triple the number in 2019, and one of the highest rates of homelessness of any state. And January is when the state makes the most shelter beds available; in warmer weather many more homeless Vermonters are unsheltered. Recent federal actions are exacerbating the problem, including efforts to criminalize unsheltered homelessness, potential cuts to homelessness assistance programs, and the elimination of access to housing vouchers for at least 131 Vermont households in 2025, with larger possible losses in 2026.
The median value of primary homes in Vermont, as reported by the U.S. Census, jumped by over $119,000 between 2019 and 2024, from $233,200 to $352,800. That’s much larger growth than in the prior five years, when the increase was $18,000. The share of homes worth more than $300,000 in the state went from one-third in 2019 to nearly 60 percent in 2024. Primary homes for sale have followed suit. The median sale price increased by 55 percent over the period.
Household income has grown just 15 percent since 2019, failing to keep up with rising home prices. In 2019 Vermonters at the median income level could afford about half of homes in the state; by 2024 that share had dropped to a third. In other words, most Vermonters cannot afford most homes in the state. The U.S. Department of Housing and Urban Development defines unaffordable housing as costing more than 30 percent of household income.
Two workers earning minimum wage will not be able to afford a standard two-bedroom apartment in the biggest metro areas in any New England state in 2026. In Vermont, the difference between their income and rent in 2026 will be more than $25,000 annually, or $6 more income hourly per earner. That’s both because the Vermont minimum wage has fallen behind the other states (except New Hampshire, where the wage is tied to the federal minimum wage) and because rents have risen. In the last five years the median rent has increased by 35 percent, more than $300 per month. More than 40 percent of units cost over $1,500 per month in 2024, compared with 15 percent in 2019.
Two workers earning minimum wage will not be able to afford a standard two-bedroom apartment in the biggest metro areas in any New England state in 2026. In Vermont, the difference between their income and rent in 2026 will be more than $25,000 annually, or $6 more income hourly per earner. That’s both because the Vermont minimum wage has fallen behind the other states (except New Hampshire, where the wage is tied to the federal minimum wage) and because rents have risen. In the last five years the median rent has increased by 35 percent, more than $300 per month. More than 40 percent of units cost over $1,500 per month in 2024, compared with 15 percent in 2019.
While energy costs have come down from their 2022 peak, they’re higher than in 2021. A Vermont household with two vehicles and using fuel oil to heat their home spent over $1,200 more in 2024 than in 2021. The volatility in energy prices, particularly for fossil fuels, makes it hard for Vermonters to predict their bills from month to month and year to year. Changing federal policies, such as weakening efficiency standards and the ending of tax credits for electric vehicles, as well as the elimination of many grants for climate infrastructure, make it harder to invest in sustainable and more durably affordable energy.
While energy costs have come down from their 2022 peak, they’re higher than in 2021. A Vermont household with two vehicles and using fuel oil to heat their home spent over $1,200 more in 2024 than in 2021. The volatility in energy prices, particularly for fossil fuels, makes it hard for Vermonters to predict their bills from month to month and year to year. Changing federal policies, such as weakening efficiency standards and the ending of tax credits for electric vehicles, as well as the elimination of many grants for climate infrastructure, make it harder to invest in sustainable and more durably affordable energy.
In addition to the pending loss of the enhanced tax credits, states are facing significant cuts to Medicaid under the reconciliation bill Congress passed in July, amounting to the loss of hundreds of millions of federal dollars to Vermont’s budget each year. More than 170,000 Vermonters across the state are covered through Medicaid, and estimates suggest 10 percent could lose healthcare.
Vermont’s total labor force has returned to its pre-Covid baseline. Roughly the same share of Vermonters, across age groups, are participating in the workforce as in 2019. More Vermonters are unemployed than in 2019, but the joblessness rate remained low, at under 3 percent in September 2025. More recent state jobs data were delayed because of the federal government shutdown. Some workers are experiencing more job uncertainty this year: The state’s roughly 6,600 federal workers—1.9 percent of the total workforce—remain at risk of layoff.
Vermont’s total labor force has returned to its pre-Covid baseline. Roughly the same share of Vermonters, across age groups, are participating in the workforce as in 2019. More Vermonters are unemployed than in 2019, but the joblessness rate remained low, at under 3 percent in September 2025. More recent state jobs data were delayed because of the federal government shutdown. Some workers are experiencing more job uncertainty this year: The state’s roughly 6,600 federal workers—1.9 percent of the total workforce—remain at risk of layoff.