State of Working Vermont 2023
Introduction
Big challenges confronted Vermont in 2023. Much of the state was inundated by the second “100-year” flood in a dozen years. Meteorologists recorded 2023 as the hottest year on record. New variants of Covid kept arising, and pandemics are predicted to become more frequent. Problems we faced before Covid are still with us: poverty, food insecurity, shortages of affordable housing and childcare. And the pandemic seems to have made some problems worse, such as inadequate mental health services, especially for children.
During the pandemic, billions of dollars poured into Vermont from Washington. Some went directly to Vermonters in the form of supplemental unemployment benefits, food relief, child tax credits, and economic stimulus payments. Billions more flowed through state and local governments, first to fight the pandemic and then to rebuild infrastructure under the American Rescue Plan Act (ARPA).
New problems like climate disasters demand new resources
These funds prevented what could have been a deep, lasting recession and reduced child poverty nationally from 2020 to 2021 by 46 percent. More recently, after the July 2023 flood, Vermonters were able to tap aid from the Federal Emergency Management Agency, or FEMA, to help rebuild their homes and their lives.
But now the federal pandemic aid is drying up—and so, thankfully, have the floodwaters. We learned from the pandemic that government can do a great deal not just to ease the pain of crises but also to prevent the ups and downs of ordinary life from becoming crises. Government help is good for people and for the economy.
It would be a mistake to ignore that lesson and return to the way Vermont raised and spent money before the pandemic. And we don’t have to. Vermont has the resources and know-how to address its problems.
For at least 30 years, Vermont’s revenue policy has been to “manage to the money”—work within whatever amount the state collects at current tax rates. It’s a passive approach that has rarely acknowledged the need for new taxes and ignores the changing demands on government.
Old problems grow more severe and expensive the longer they’re neglected. And new problems that the state didn’t face 10, 20, or 30 years ago, like the damaging effects of climate change and more frequent pandemics, demand new resources. Even after the devastation caused by Tropical Storm Irene, neither the governor nor the Legislature asked Vermonters for anything more in taxes. Instead, they expected government to absorb the cost of responding to the disaster, drawing from funds already allocated for other state services.
The state should raise enough revenue to meet the statutory purpose of the state budget: “to address the needs of the people of Vermont in a way that advances human dignity and equity.” 1 The statute goes on to say that Vermont’s tax and spending policies are supposed “to promote economic well-being … and a vibrant economy,” advance the state’s policy goals, and “recognize every person’s need for health, housing, dignified work, education, food, social security, and a healthy environment.”
Raise necessary revenue to address needs in a way that advances human dignity and equity
Vermonters can take pride in the state’s history of support for education, health care for low- income families, environmental protection, and other public investments. In its 2023 session, the Vermont Legislature built on the progress made during the pandemic and began to invest robustly in family economic security, childcare, and reducing childhood hunger. It expanded the Child Tax Credit and Earned Income Tax Credit and committed $125 million annually to expand access to high-quality childcare and make it more affordable.
These are encouraging steps. But poverty is still too high, too many Vermonters are homeless, and people and property are increasingly vulnerable to climate disasters. There is more to be done. Raising money fairly and investing it wisely, the state can address Vermonters’ needs and promote dignity and equity.
Moving forward requires setting goals and priorities. And to map where the state wants to go and how to get there, policymakers need to determine first where we are. State of Working Vermont 2023 can help them draw that map.
The Data
As in previous years, this report uses data from the U.S. Census—primarily one-year estimates from the American Community Survey—as indicators of Vermonters’ well-being. It also relies on data from the Vermont Department of Labor, the U.S. Bureau of Labor Statistics, the U.S. Bureau of Economic Analysis, and other sources. With Census indicators, we compare data from 2019, the most recent year unaffected by the Covid pandemic, with 2022 data, the most recent available. Where 2023 data are available from other sources, we have included them.
The American Community Survey did not publish state-level estimates for 2020. And labor market statistics were hard to interpret as businesses closed and reopened. But by 2022 the data appear to reflect real trends rather than short-term, anomalous changes.
This report also looks at how Vermont has been doing relative to other states. Where comparisons are useful, the report provides Vermont’s national rankings. A ranking of 1 is the best, with 50 being the worst.

Workers and Jobs
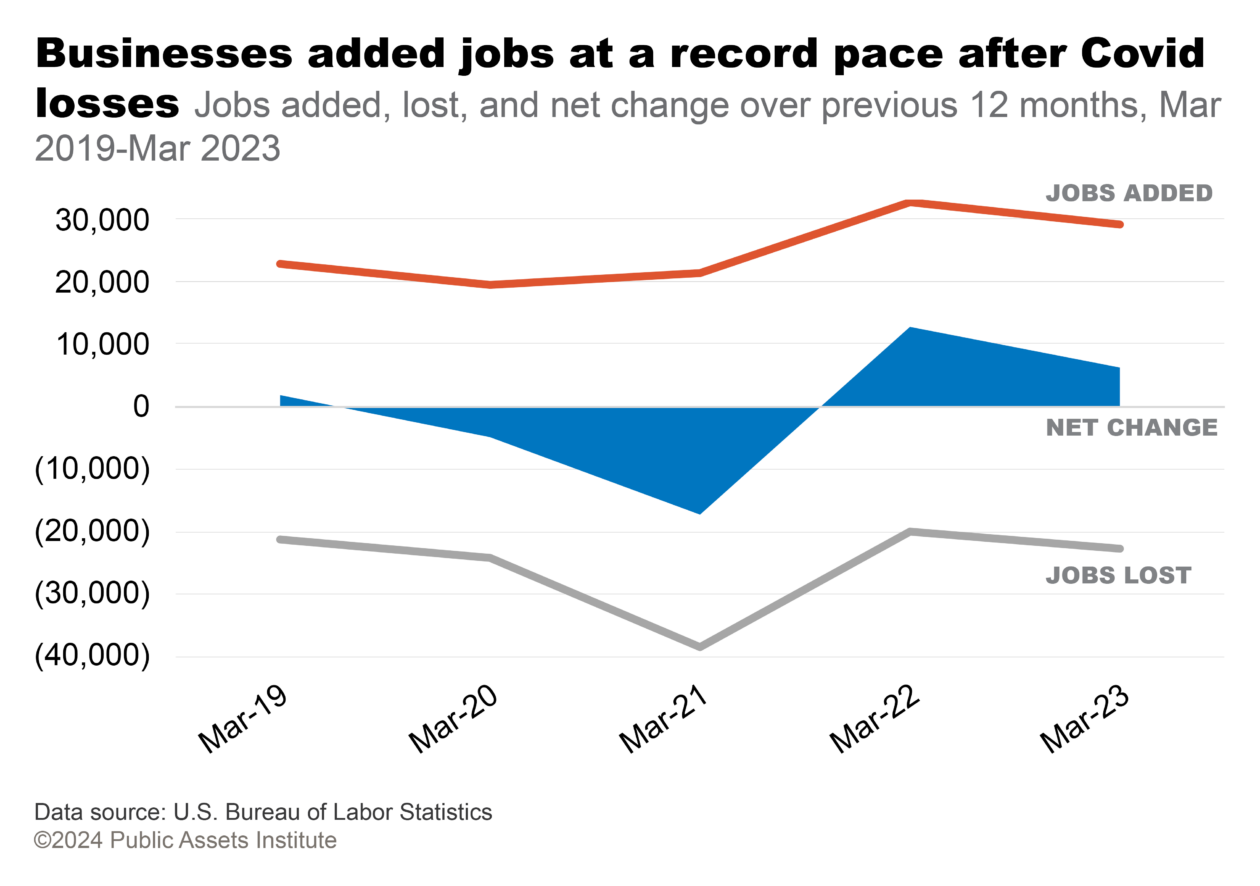
Vermont’s private employers created jobs at a record pace—the fastest in more than 20 years—between March 2021 and March 2023, after Covid vaccines became available and people returned to work.
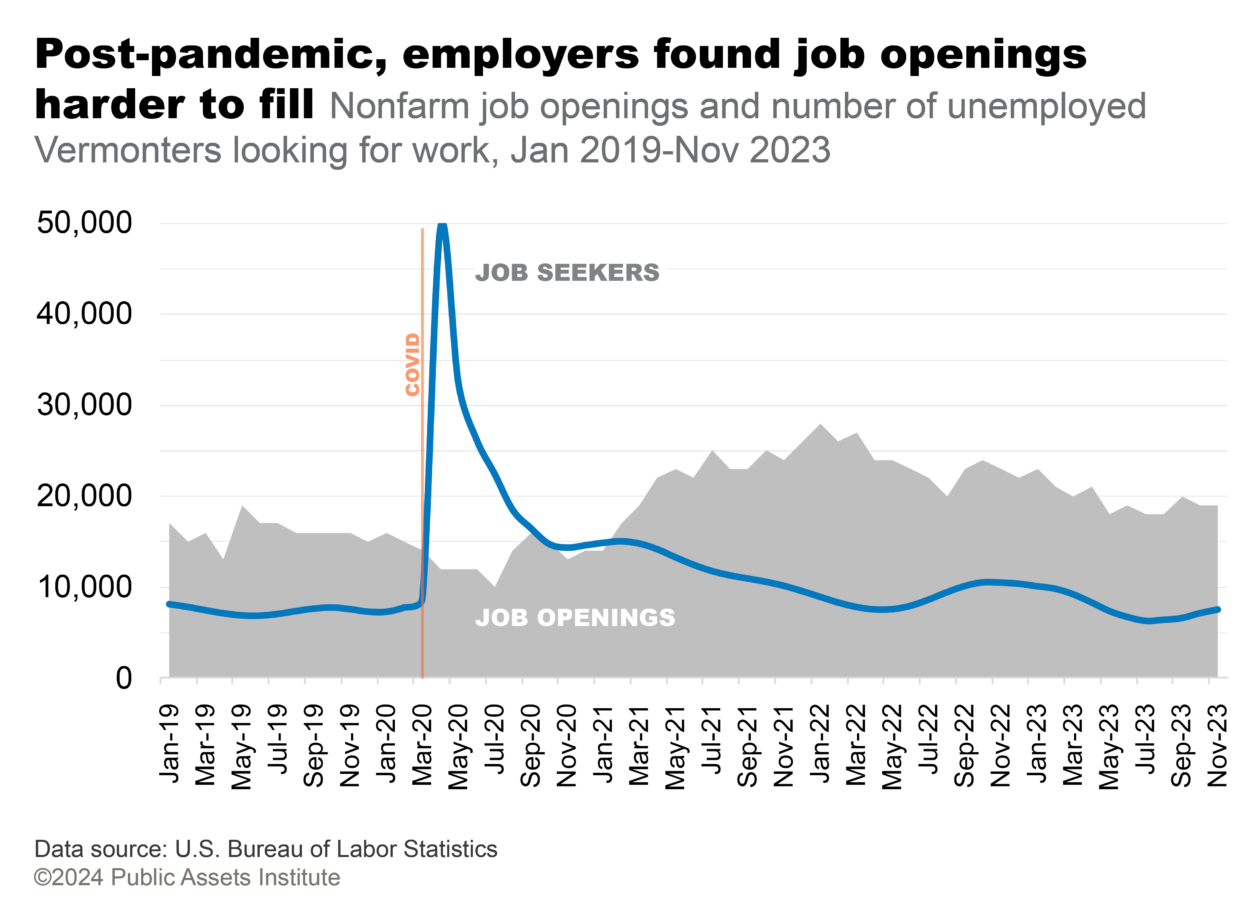
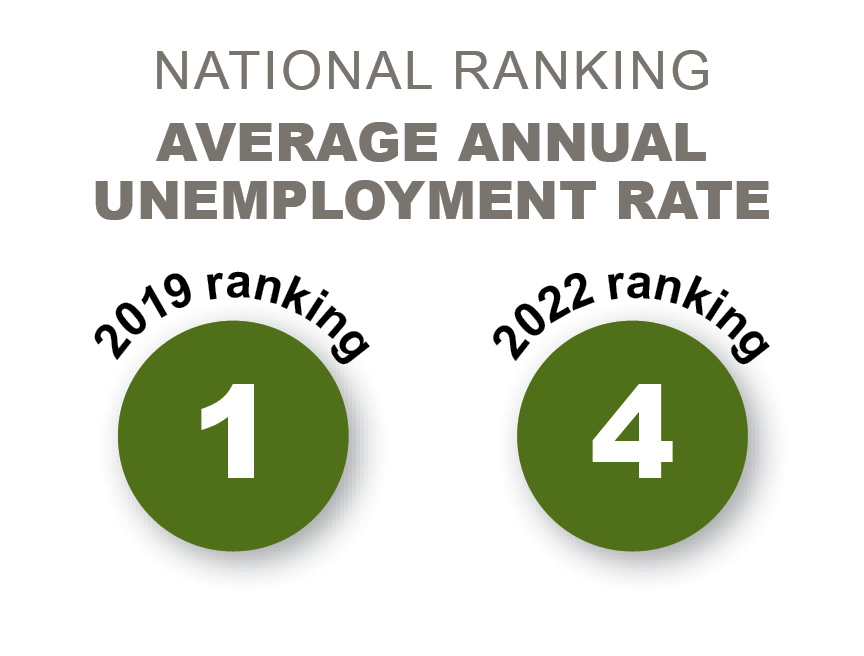
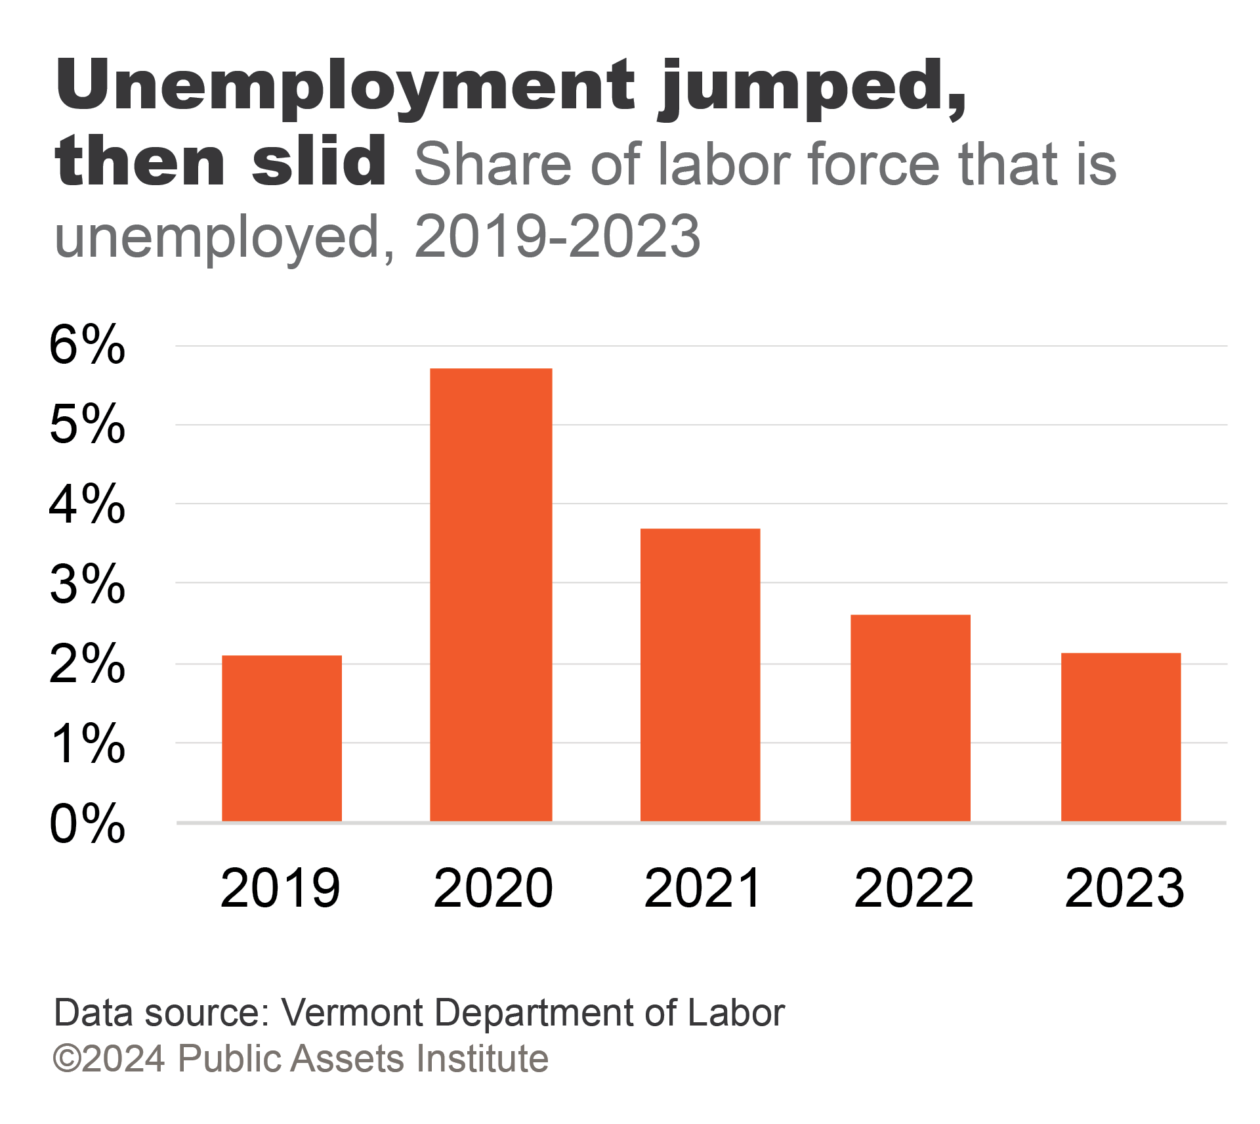
The unemployment rate stayed low. It remained below 2 percent through the summer months and at the close of 2023 had risen only to 2.2 percent—about 7,700 people without jobs. Despite the strong job market, by the end of 2023 Vermont’s labor force had not quite returned to pre-pandemic levels. The tight labor market meant that most Vermonters looking for work were able to find it while employers struggled to fill jobs.
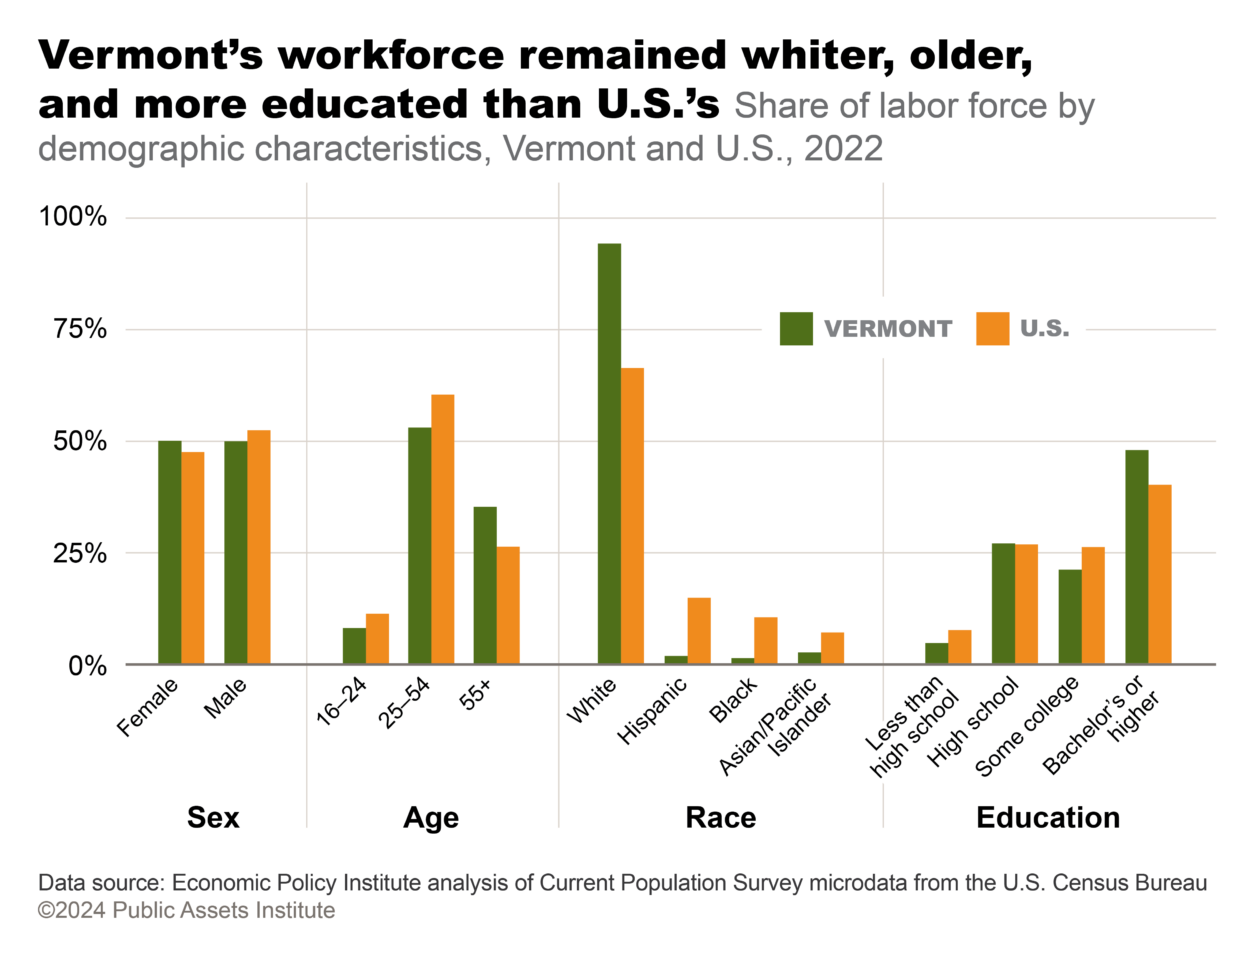
Vermont’s workforce remained whiter, older, and more educated than the rest of the nation’s, even as the state has become more racially diverse in the past decade.
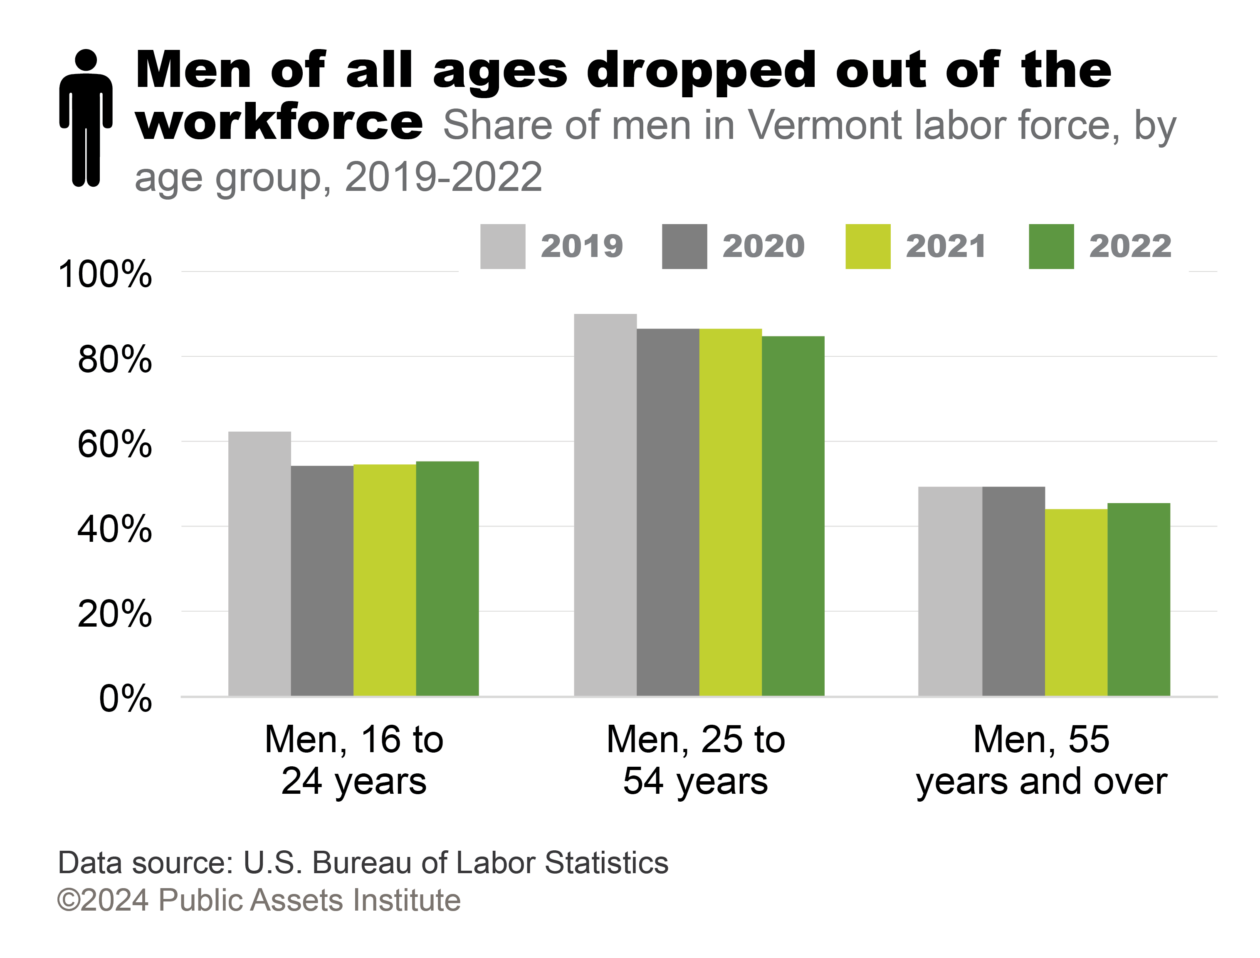
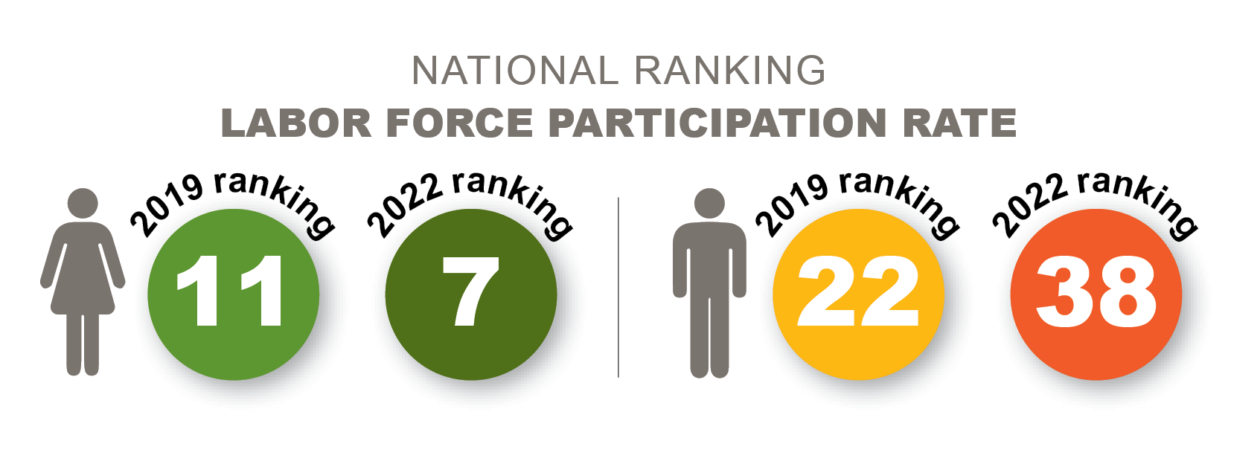
Gender made a difference in the trends. A greater share of men than women dropped out of the labor force during Covid, and men stayed out at higher rates. Ranking the states, the proportion of working-age men active in the Vermont workforce dropped from the top half in 2019 to the bottom quarter in 2022. The proportion of women in the labor force rose from 11th place to 7th.
Jobs Added and Lost
Jobs Added and Lost
Employers create and eliminate thousands of jobs every year. When the Vermont Department of Labor reports the monthly or annual change in jobs, that is the net number: total jobs added minus total jobs lost. Net job growth is an important indicator, but the gross numbers provide additional insight into the pace at which employers create jobs; the source of new jobs, whether existing businesses or startups; and the number of jobs lost as a result of business closures.
Thousands of Vermonters lost jobs practically overnight when the Covid-19 pandemic forced businesses to close in the spring of 2020. Then, as vaccines became available and people grew more comfortable in public spaces, Vermont employers moved relatively quickly to staff up. From March 2021 through March 2022, private employers added more than 32,500 jobs. That was the largest number created in a 12-month period since at least the early 1990s and about 50 percent more than employers had created in an average year. Between March 2022 and March 2023, Vermont’s private sector again added close to 30,000 jobs, 35 percent of them by startup businesses, which was also a record.
Job Openings
Despite the record number of jobs created in 2021 and 2022, employers might have been able to create more jobs if they’d found additional workers. Vermont’s unemployment rate remained under 3 percent for all of 2023, among the lowest in the country. And for most of the year, there were more than two and a half jobs available for each person looking for work. For the last few months of 2023, Vermont’s ratio of job openings to unemployed worker was double the U.S. ratio. At the state level there are no details about the types of jobs available or the levels of pay—information that might help explain why more Vermonters have not rejoined the workforce.
Job Openings
The U.S. Bureau of Labor Statistics tracks job openings reported by employers monthly, by state. Comparing job openings to the number of people who are officially unemployed—that is, jobless and actively seeking work—provides a measure of the labor market. In times of recession, there may be five or more unemployed workers per job opening. In the current period of low unemployment, there are more jobs than people to fill them.
Labor Force Statistics
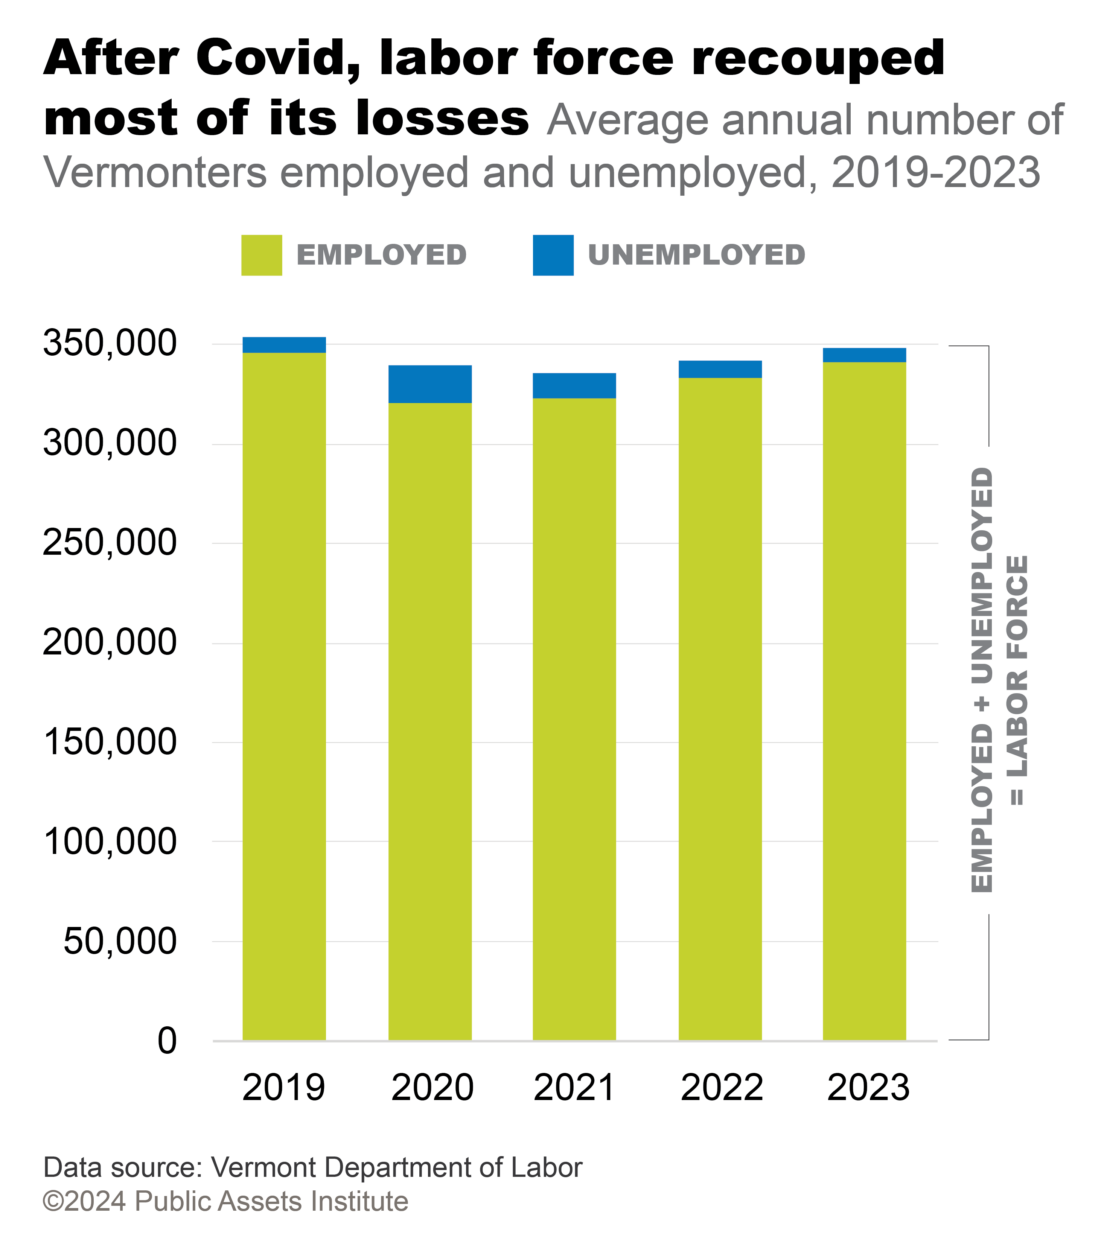
The average number of Vermonters working in 2023 didn’t quite reach pre-pandemic levels, but it was close—down by about 1 percent. The number of unemployed in 2023 fell below the 2019 number, but again the difference was small. Vermont’s 2023 unemployment rate was 2.1 percent, the same as the 2019 rate and well below the U.S. rate of 3.6 percent.
Labor Force Statistics
Each month the U.S. Bureau of Labor Statistics and the Vermont Department of Labor report four key statistics about the labor force, which are based on household surveys:
- Labor force: people employed and unemployed.
- Employed: payroll workers, farmworkers, and the self- employed.
- Unemployed: people not employed who have actively looked for work in the previous four weeks.
- Unemployment rate: number of people employed as a percentage of the labor force.
Labor Force Demographics
Vermont’s workforce numbered about 350,000 people in 2022. It was less diverse, older, and better educated than the U.S. overall. Although Vermont’s population has grown somewhat more diverse in recent years—people of color accounted for 6.2 percent of Vermont’s population in 2019 and 9.1 percent in 2022—the demographic profile of its workers remained largely unchanged.
Labor Force Demographics
The labor force is the number of people age 16 and over available to work. The U.S. Census breaks down the labor force by different demographics through the Current Population Survey, including sex, age, race, and education level.
Labor Force Participation Rate
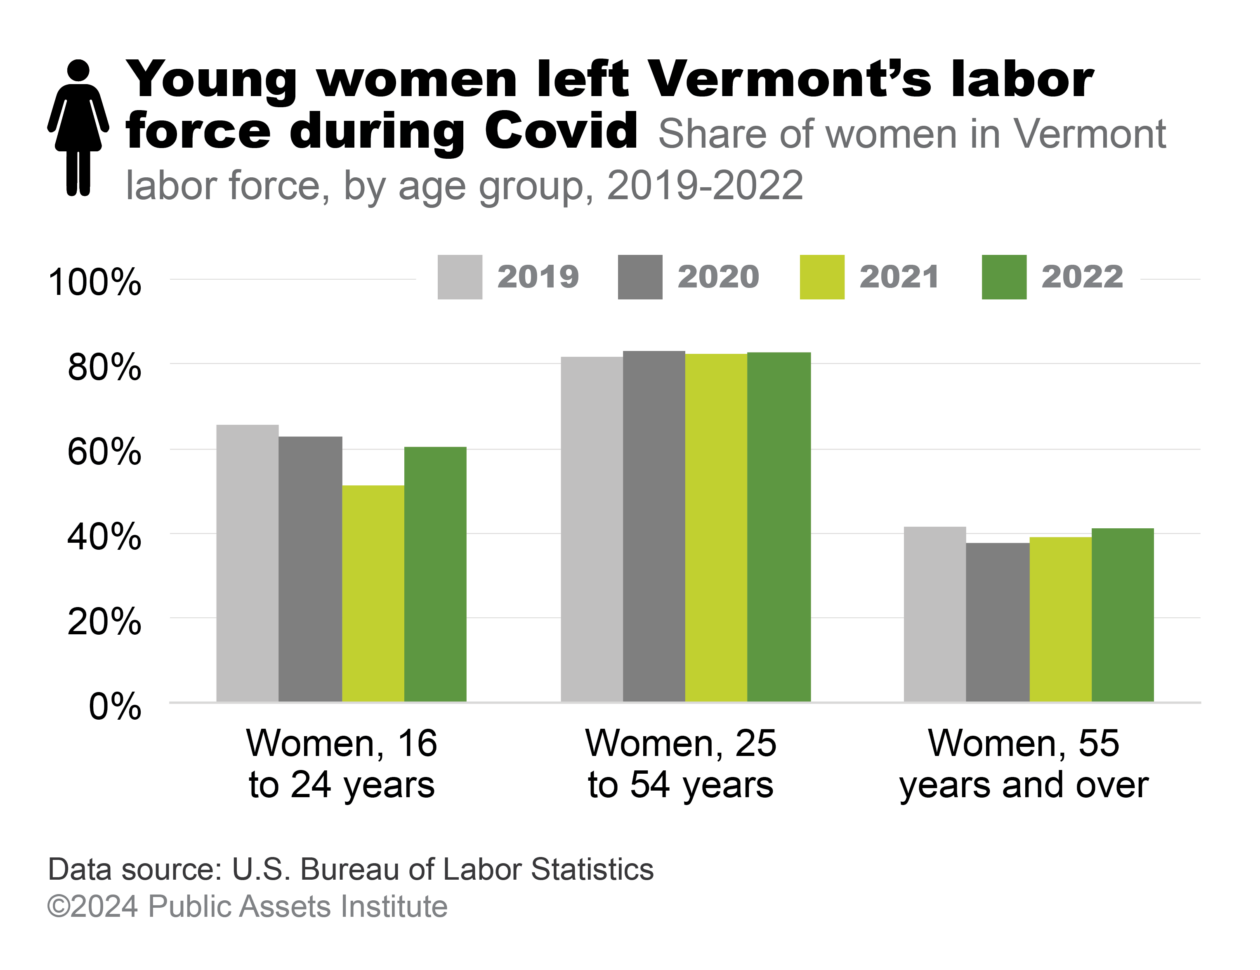
Young women dropped out of the labor force during Covid but had largely gone back to work by the end of 2022. Women 25 and older mostly remained in the labor force through the pandemic and through 2022. Men in all age groups dropped out of the labor force during Covid and had not returned by 2022.
Labor Force Participation Rate
The labor force comprises people who are employed and those who are unemployed and actively looking for work. The labor force participation rate is the percentage of working-age people (16 and over) who are in the labor force.
County Employment
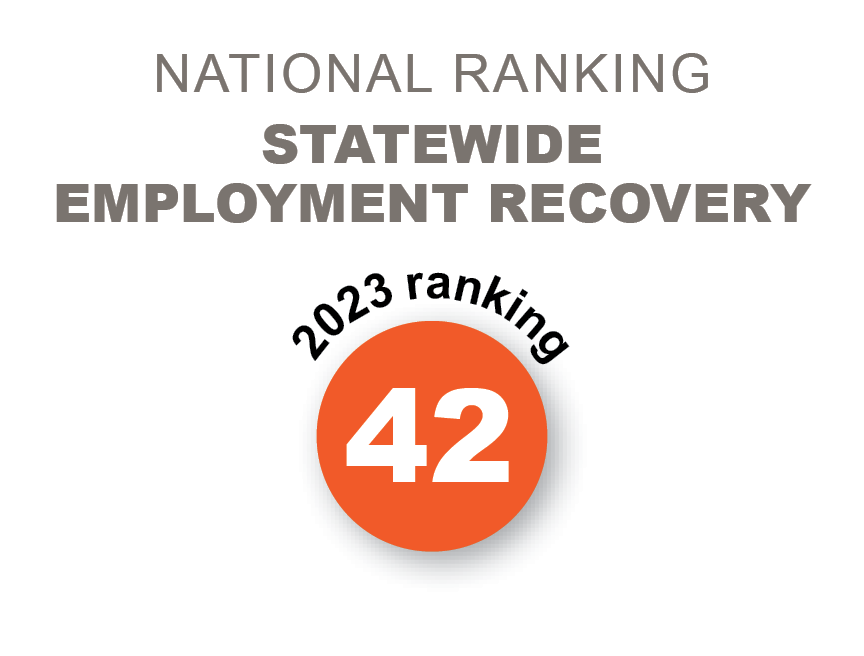
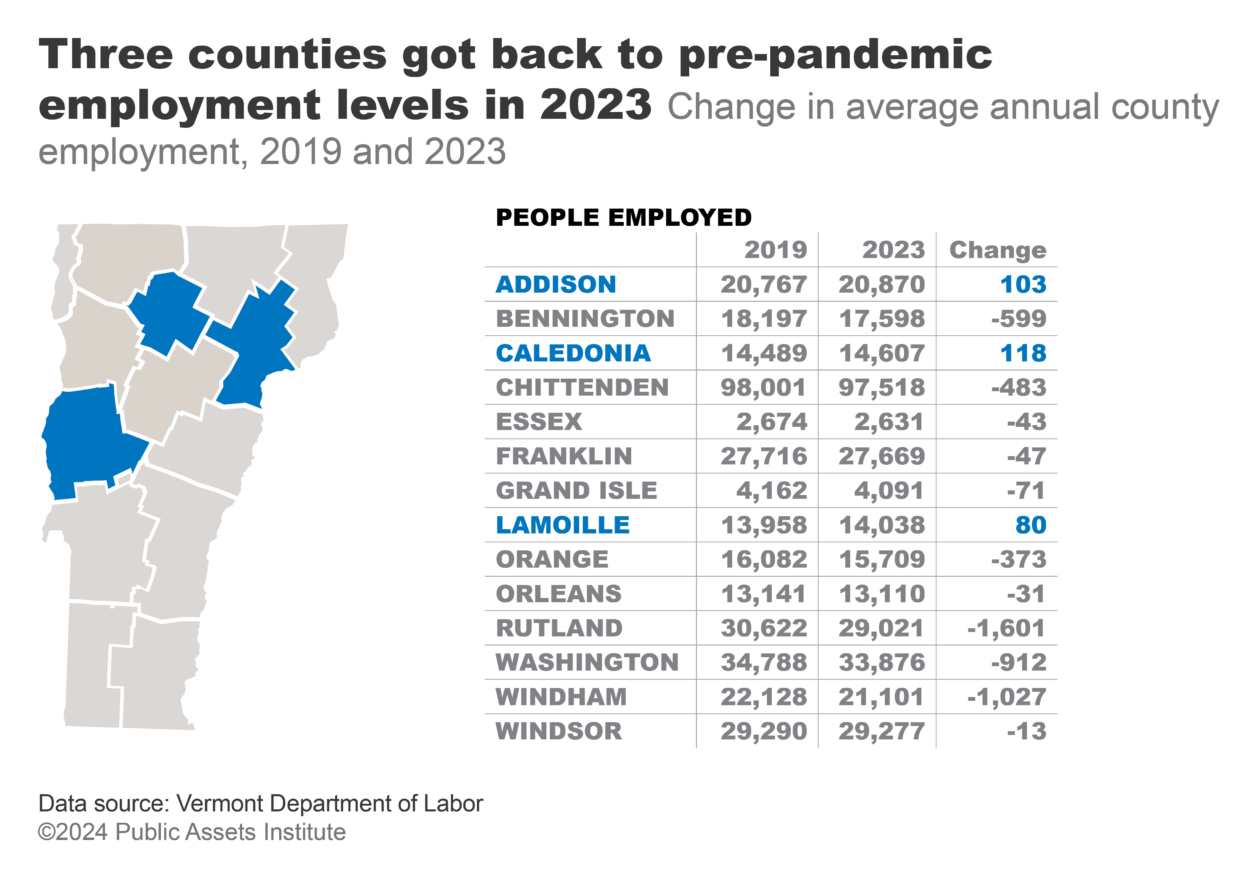
Addison, Caledonia, and Lamoille were the only Vermont counties that recorded more people working in 2023 than in 2019, although the increases all fell below 1 percent. Rutland and Windham counties saw the largest drops in employment over that period, 5.2 and 4.6 percent respectively. Vermont was one of 16 states that had not recovered pre-pandemic employment levels by the end of 2023.
Progress
Several Vermont economic indicators were pointing in the right direction:
- Wages were up among the lowest-paid workers.
- The poverty rate dropped.
- The percentage of Vermonters with health insurance inched up, taking Vermont from fourth to third in national ranking.
- 3SquaresVT benefits increased.
One indicator showed slight erosion, although Vermont did well relative to the rest of the country:
- The pay gap between women and men grew slightly. Women earned 89 cents to a man’s dollar in
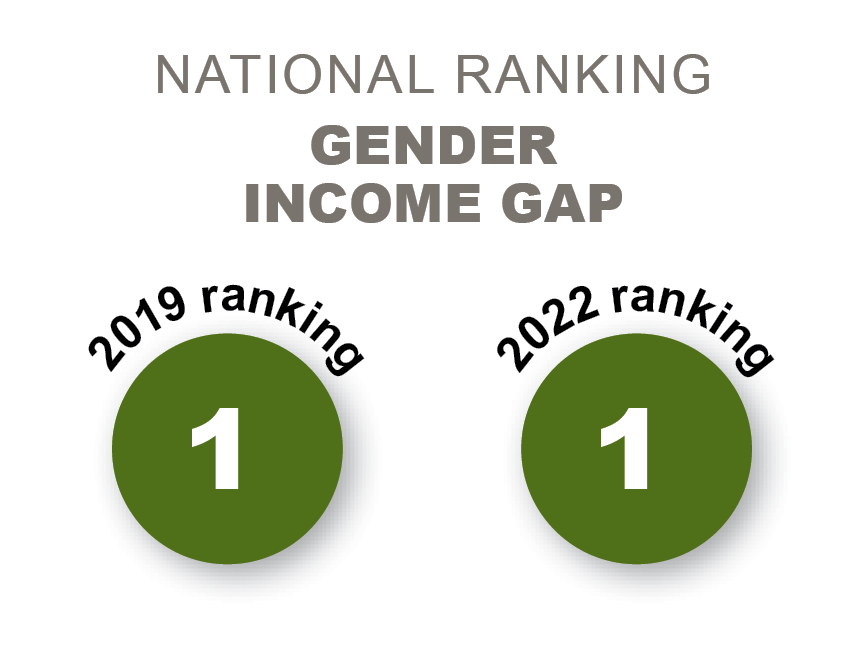
2022, compared with 91 cents in 2019. Still, Vermont kept its place as the state with the highest income equality by gender.
Real Median Household Income
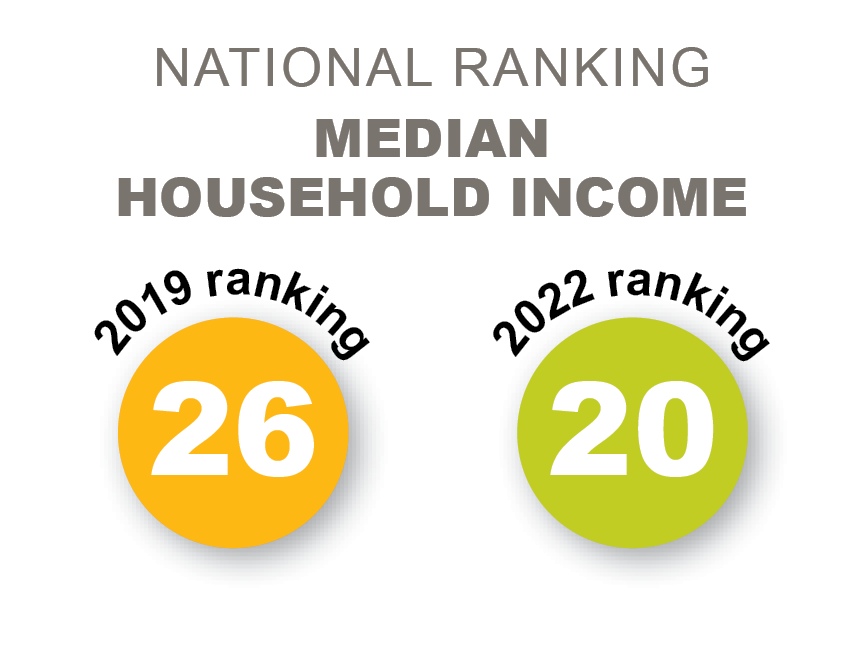
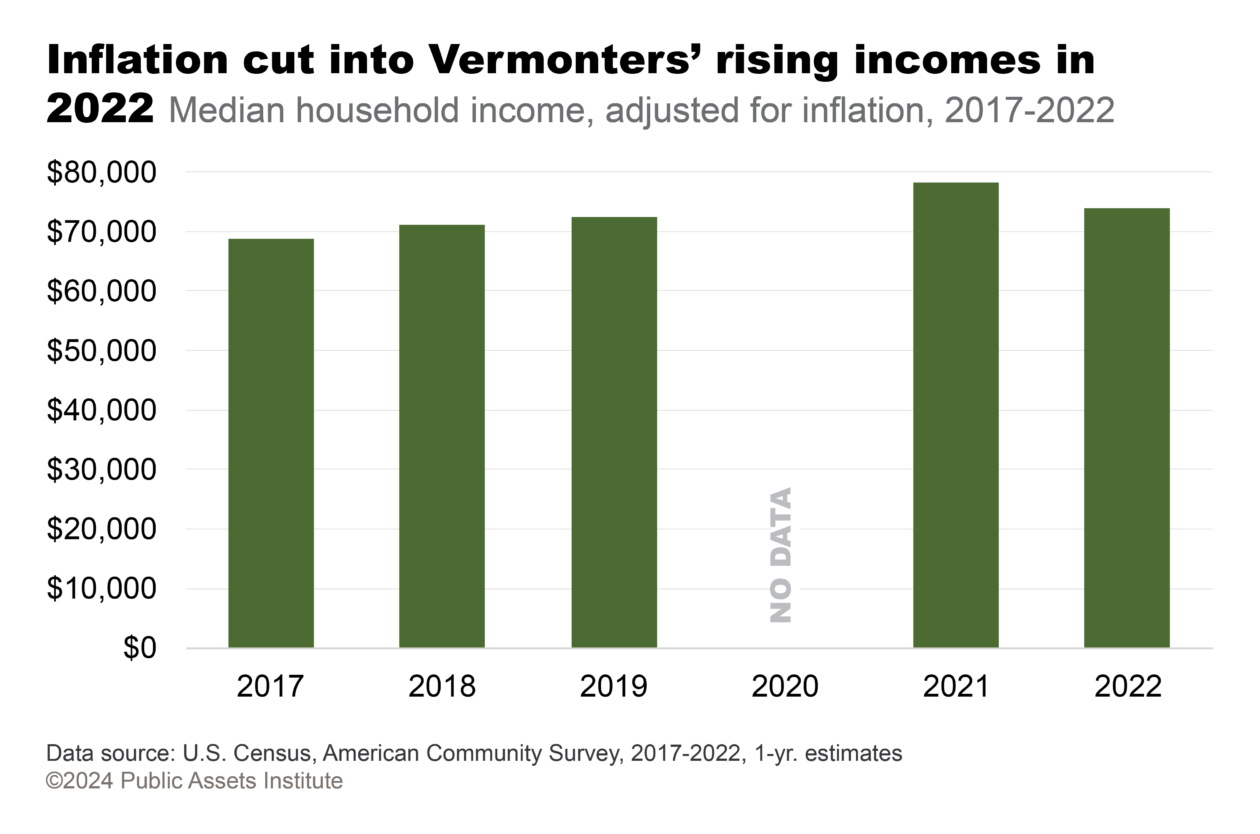
After years of stagnation, Vermont finally began to see some growth in real median household income in 2018. Then the pandemic struck. The Census did not publish American Community Survey data for 2020, but between 2019 and 2021 Vermont experienced the biggest growth in median household income in the country. New Hampshire was second. Inflation rose to 8 percent nationally in 2022, causing a loss in buying power everywhere. But from 2021 to 2022, for reasons that are not clear, Vermont and New Hampshire saw the biggest decreases in real median household income in the country. Nevertheless, real median household income was essentially the same in 2022 as it was in 2019.
Real Median Household Income
Median household income is the middle amount of annual income— half of Vermont households receive more than the median and half receive less. Household income includes the income of all household members over the age of 15. Real median household income has been adjusted for inflation, in order to compare the relative buying power of the median household over time.
Gender Gap
Gender Gap
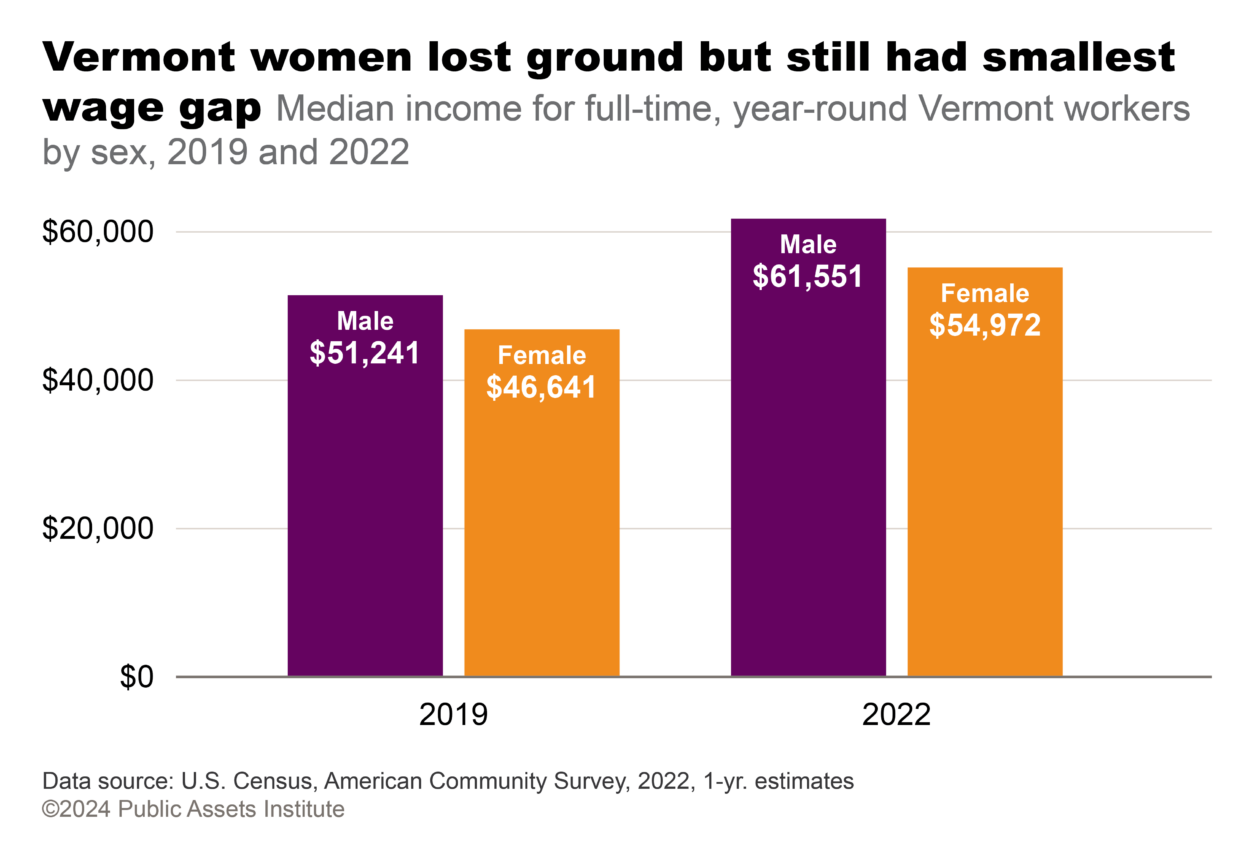
One measure of pay disparity between men and women is the median income for full-time, year- round workers. It is often expressed as the amount of income the typical female worker receives for each dollar received by the typical male worker.
The income gap between Vermont women and men was the smallest in the country before the pandemic, and it was still the smallest in 2022. Nevertheless, women lost some ground in the interim. Median income for a full-time, year-round female worker in 2022 was $54,972; her male counterpart earned $61,551. Calculated another way, the median female worker earned 89 cents for each dollar earned by the median male worker. Before the pandemic, however, women were earning 91 cents for each dollar men received.
Hourly Wages by Percentile
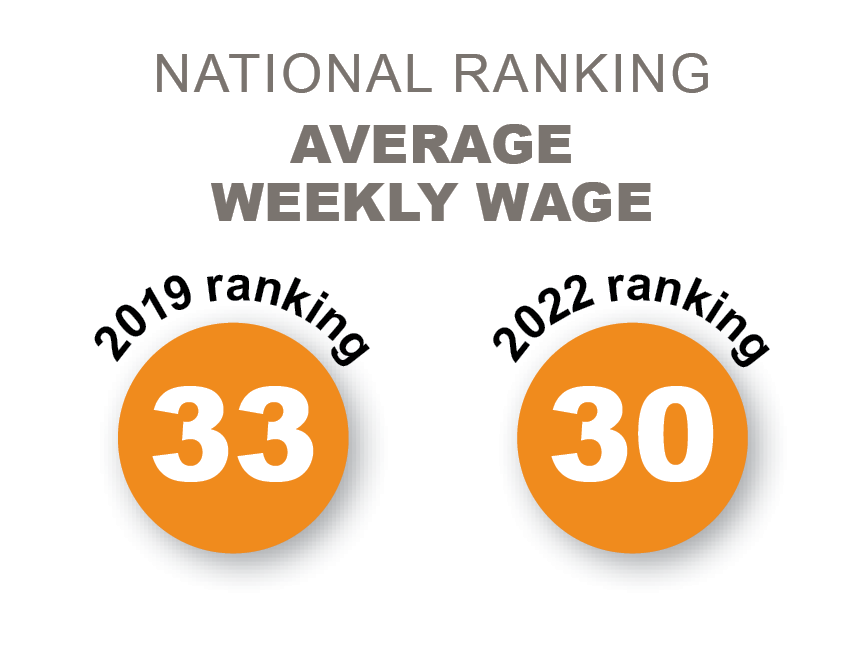
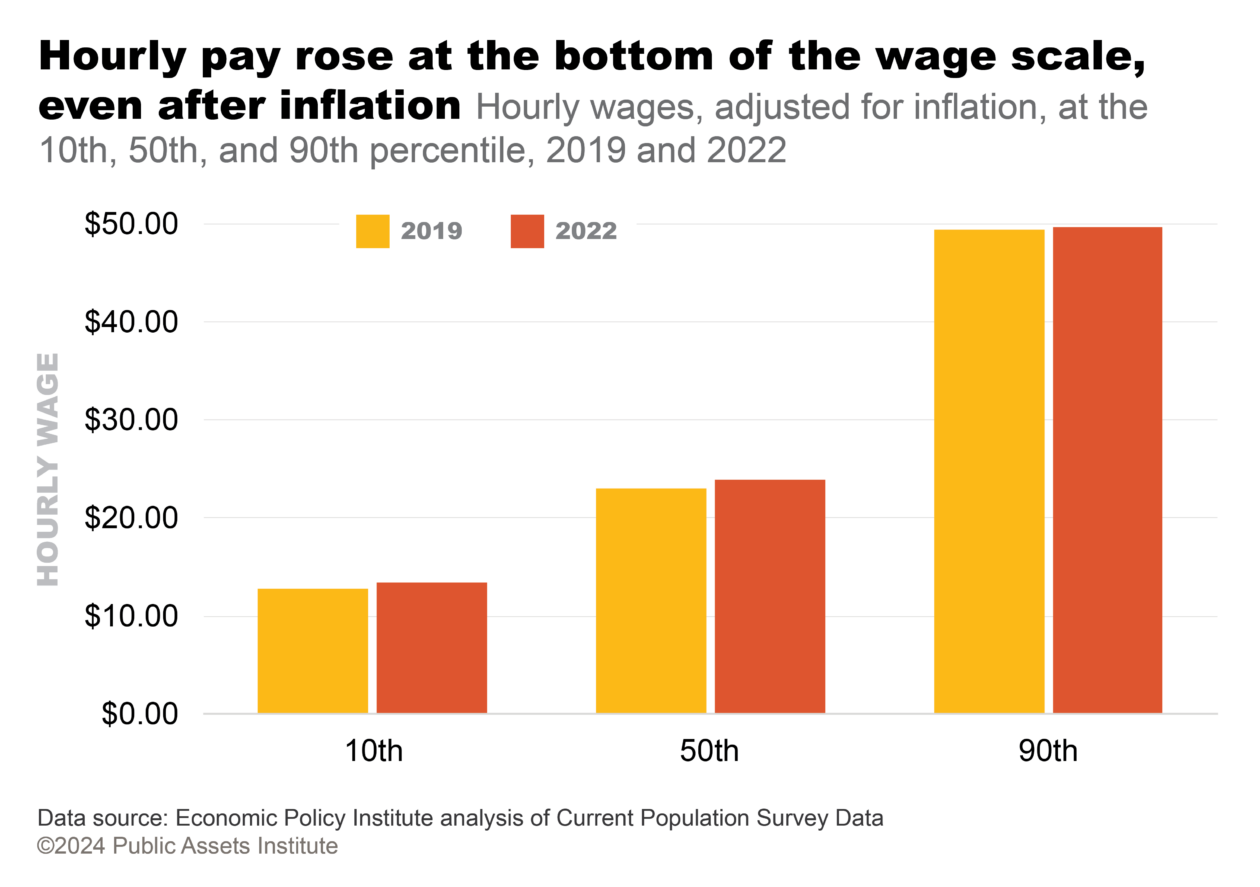
Vermont employers had difficulty finding workers in the wake of the pandemic, and the shortage helped lift wages, especially at the lower end of the pay scale. Inflation rose 8 percent in 2022, which cut into the wage increases. Even after adjusting for inflation, though, wages for the lowest-paid workers rose more than 4 percent from 2019 to 2022.
Hourly Wages by Percentile
Percentile wages are calculated by ranking the hourly wages of full-time workers and dividing them into equal-size groups. The 10th- percentile wage is the highest wage paid to the bottom 10 percent of workers, the 20th-percentile wage is the highest wage paid to the bottom 20 percent, and so on. The 50th- percentile wage is the median wage, meaning that half of all workers are paid less than that amount, and half are paid more.
Health Insurance Coverage
Health Insurance Coverage
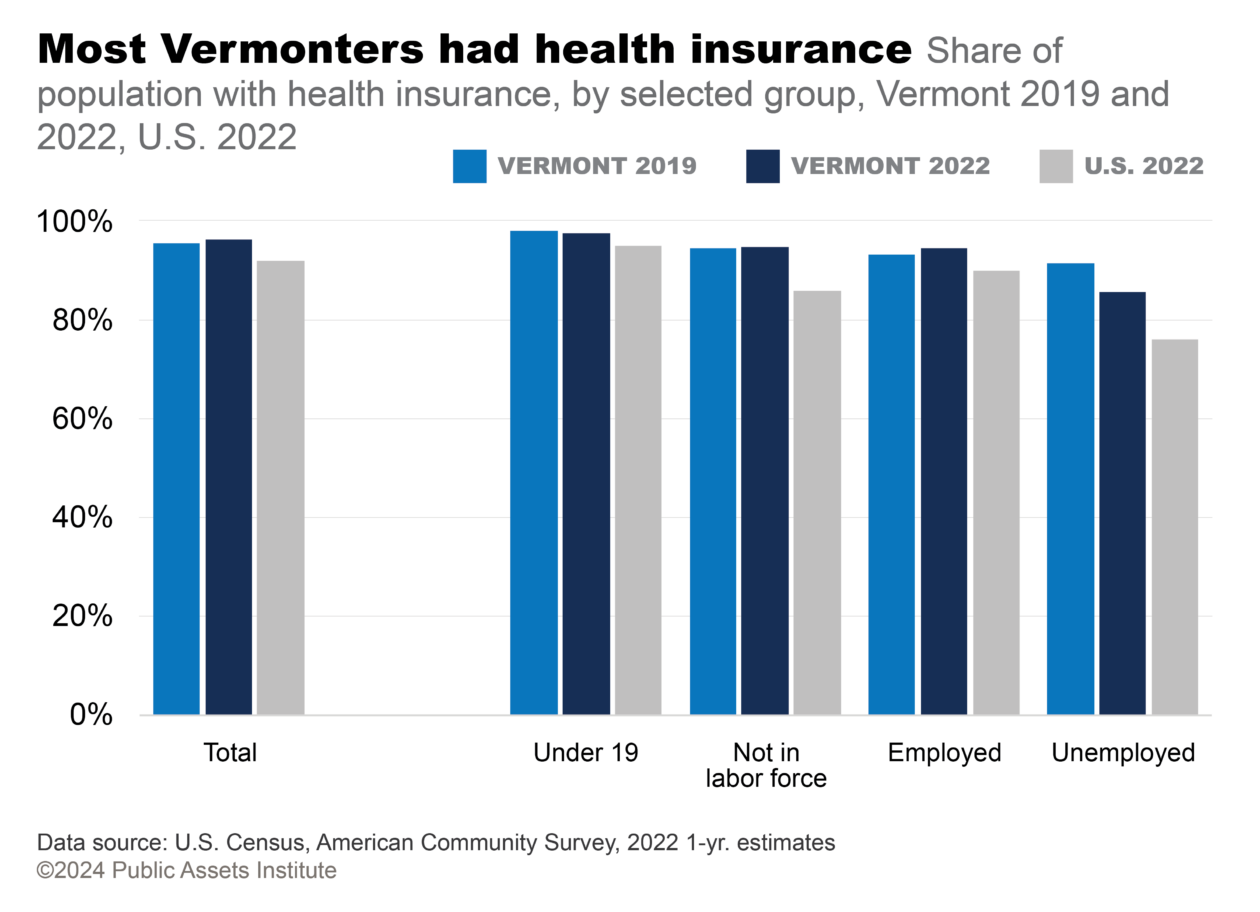
Health insurance coverage is the percentage of the population with health insurance, privately or publicly funded, or both. The U.S. Census has been tracking coverage since 2008 by many demographics, including employment status.
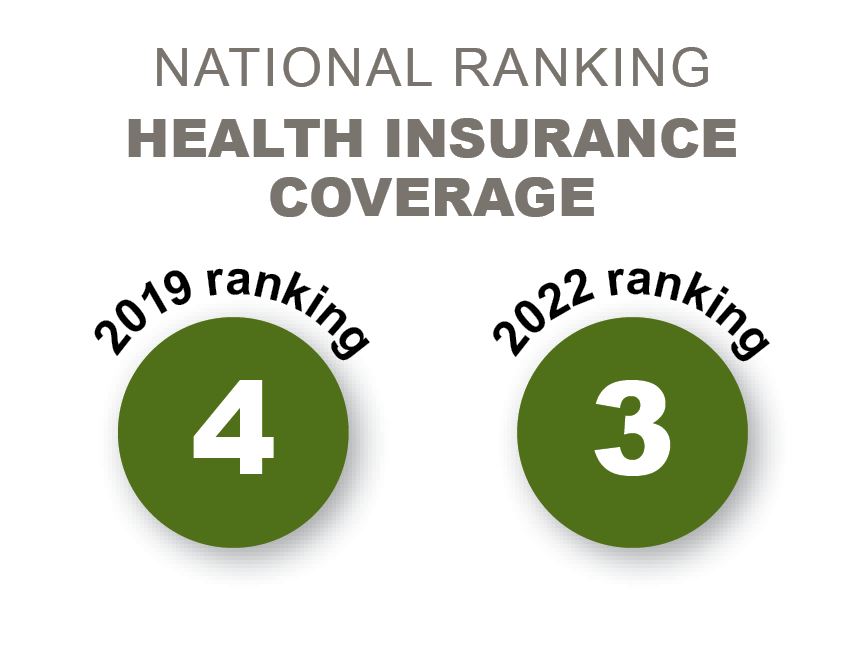
More than 96 percent of Vermont residents had health insurance in 2022, putting Vermont in third place nationally. Approximately 25,000 Vermonters did not have health insurance. In addition, many of those with insurance did not have adequate coverage. The 2021 Vermont Household Health Insurance Survey found 38 percent of Vermonters up to age 65 were underinsured, which was defined as having excessive out-of-pocket medical expenses or high deductibles. 2
Supplemental Poverty Measure
Supplemental Poverty Measure
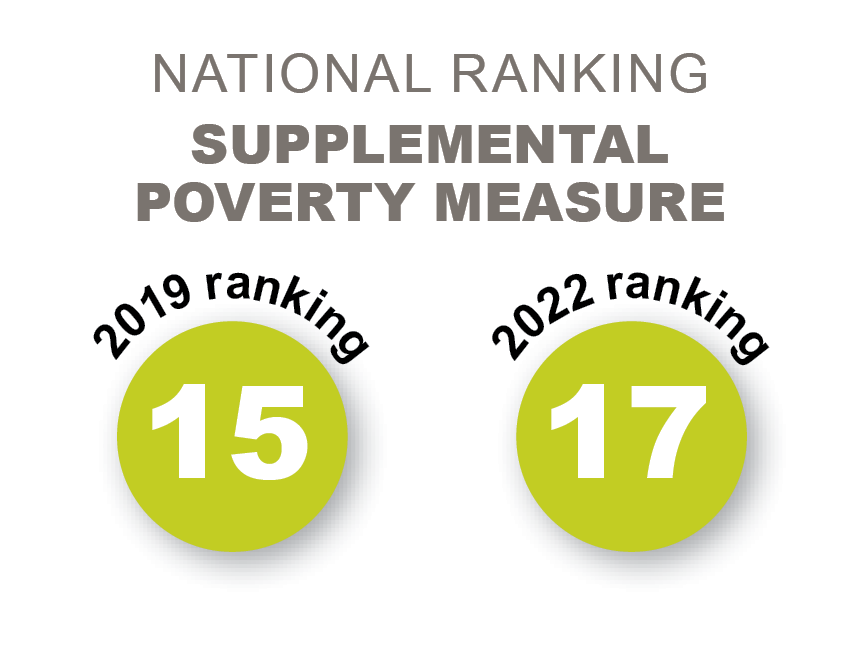
The Supplemental Poverty Measure (SPM) was introduced in 2009 as a more comprehensive and accurate measure of poverty. Unlike the official poverty measure, which counts only cash income and the cost of food, the SPM includes cash income and noncash benefits such as tax credits, food assistance, and childcare and health care subsidies. It also has a broader definition of the cost of living, which includes food, clothing, shelter, utilities, and medical expenses.
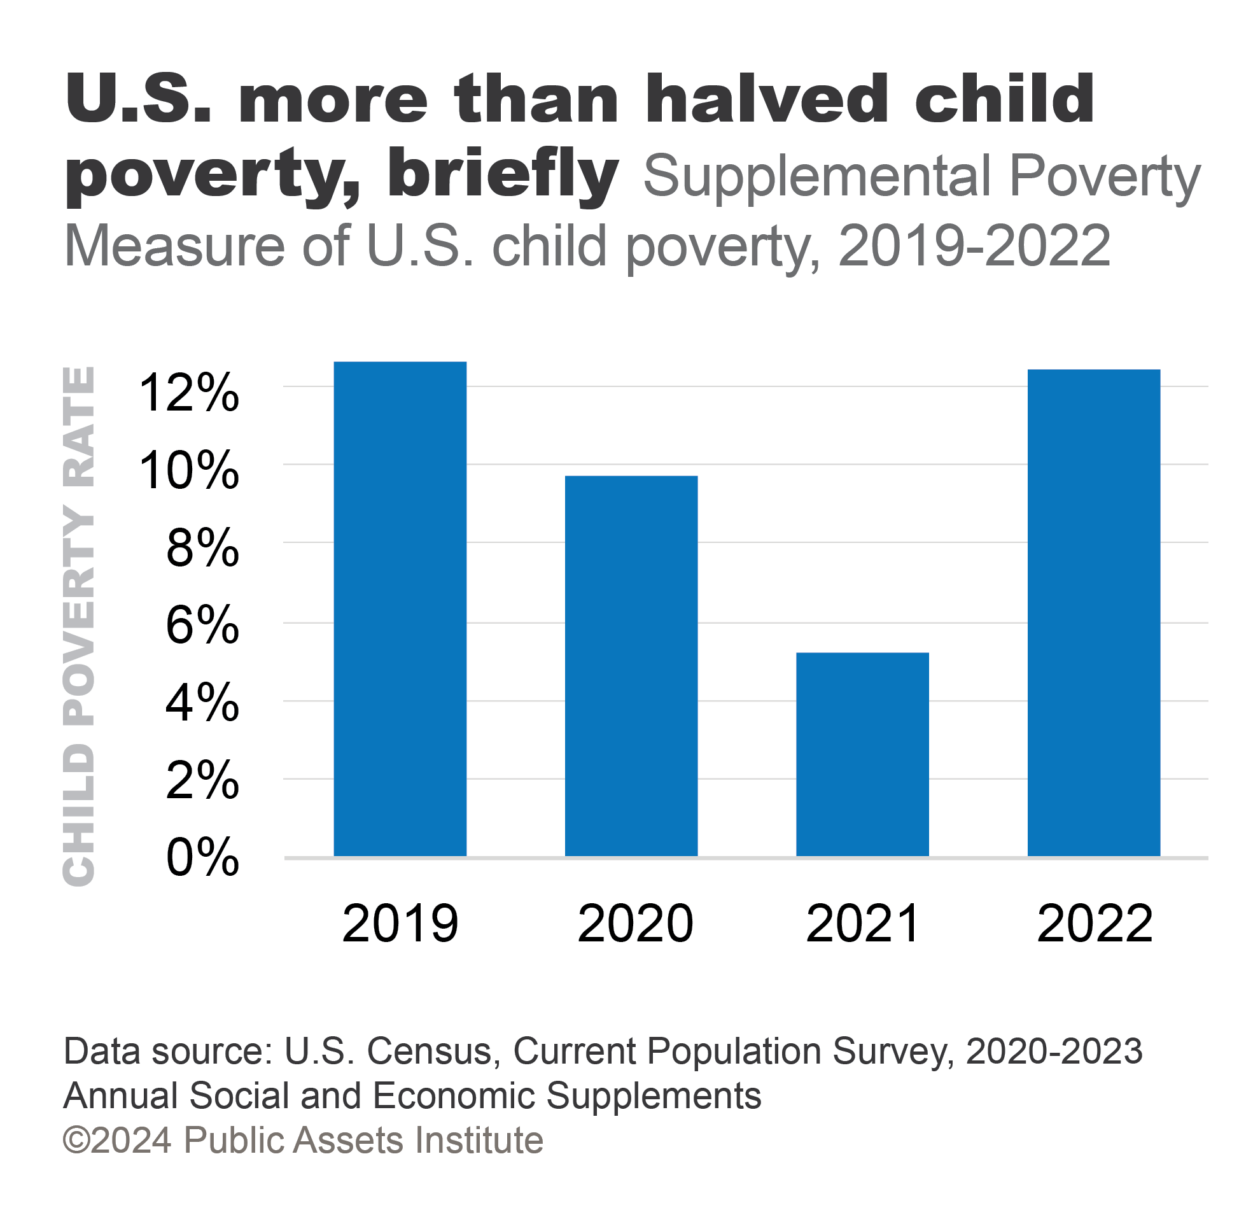
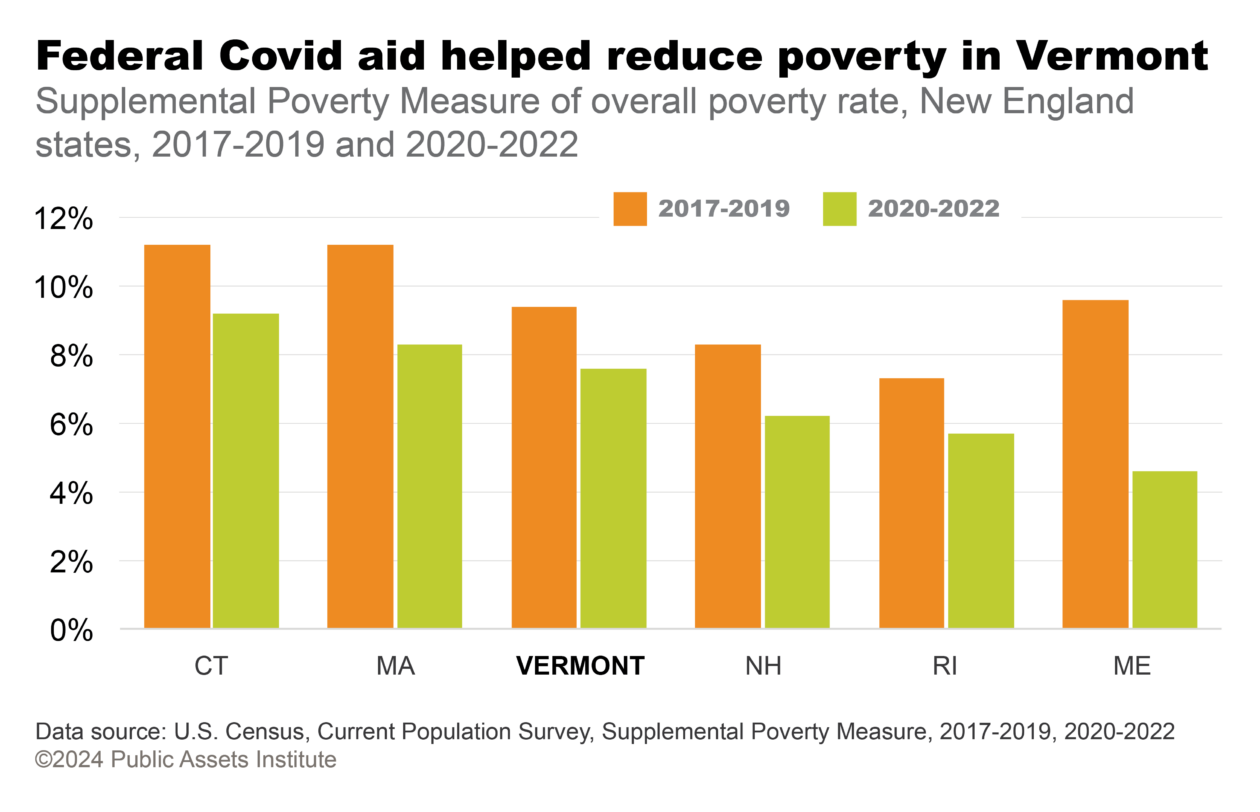
During the pandemic, federal cash, increased child tax credits, and other benefits helped low-income families. As a result, Vermont, like other states, saw a significant drop in its overall poverty rate. Annual Supplemental Poverty Measure data specifically for child poverty are not available for individual states, so Vermont can’t use this measure to determine how its children fared. But nationally child poverty dropped to 5.2 percent in 2021. And when the 2021 federal Child Tax Credit expansion ended the following year, U.S. child poverty jumped back to more than 12 percent.
Note: Since state-level SPM numbers and rates are calculated as three-year averages, Vermont’s numbers do not show as sharp a rate drop from 2020 to 2022 as the annual U.S. data show for the single year 2021. The effect of the state’s increased Child Tax Credit, enacted in 2022, is not discernible in the three-year data either.
Refundable Tax Credits
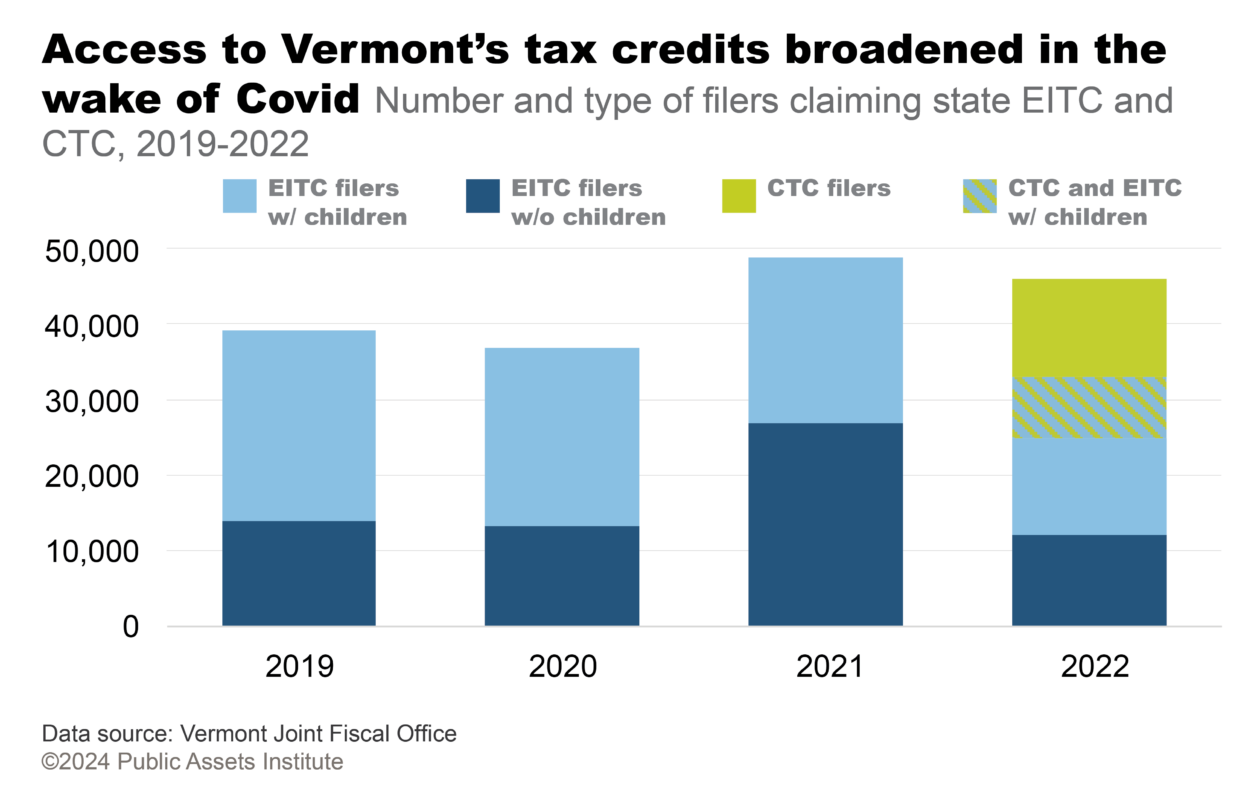
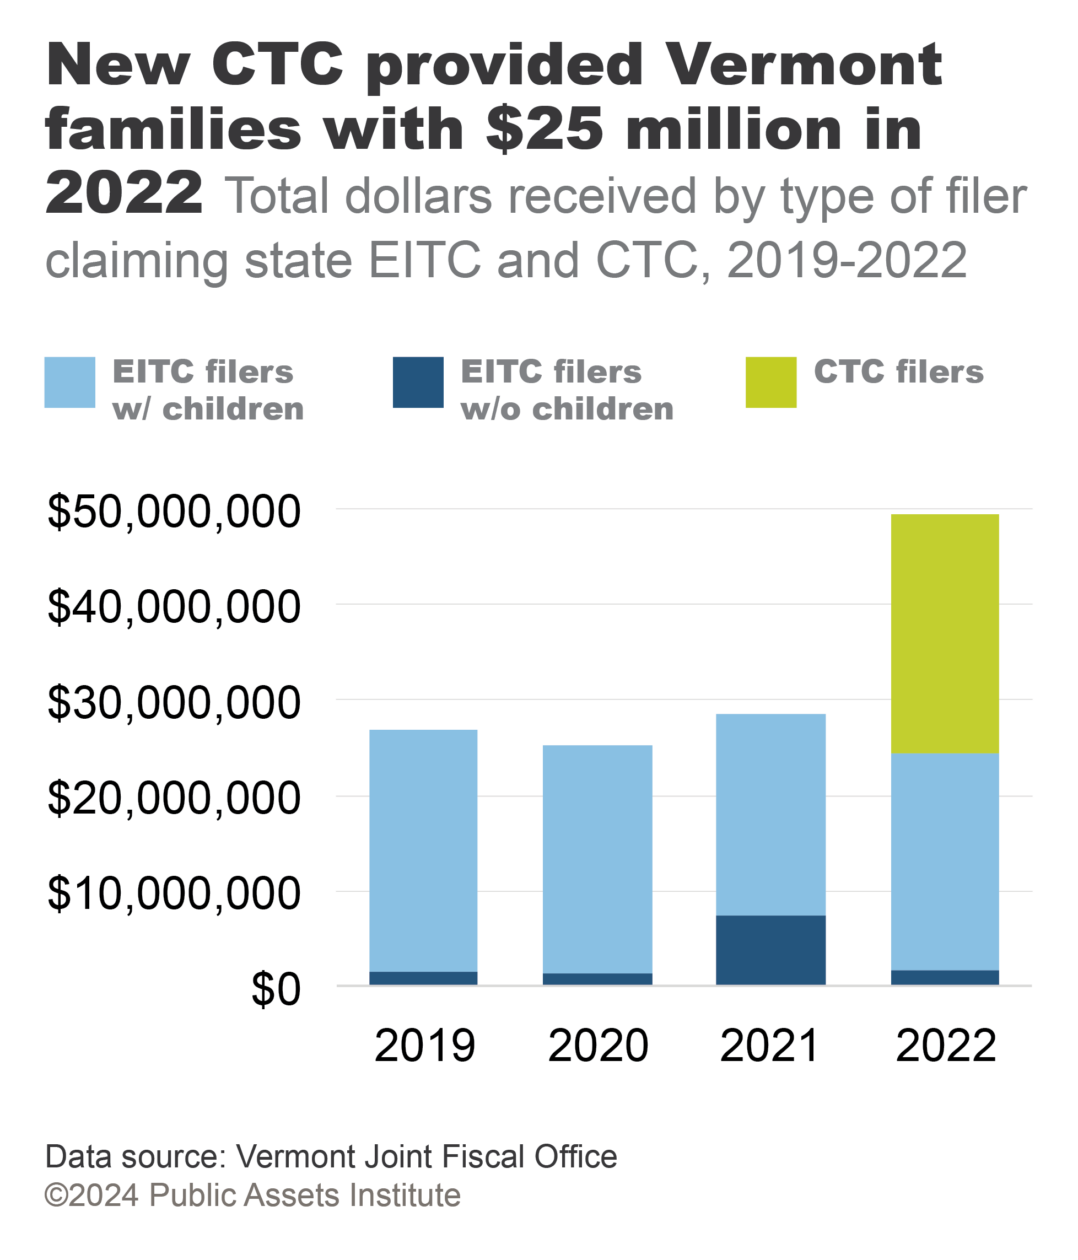
The Earned Income Tax Credit (EITC) and Child Tax Credit (CTC) greatly reduce poverty for working families.3 Those eligible for the federal EITC also get the state credit, which is a percentage of the federal. In 2021 the federal EITC for filers without children was temporarily increased and eligibility expanded with Covid relief funds.
In 2022, the Vermont Legislature enacted a Child Tax Credit to families with young children. Families with incomes up to $125,000 are eligible for a $1,000 annual credit for each child under age 6. Smaller credits are available to families with incomes between $125,000 and $175,000.
Refundable tax credits
Refundable tax credits are used to reduce personal income taxes; if the credit is more than the taxes due, the taxpayer receives the difference as a tax refund. Vermont’s Earned Income Tax Credit (EITC), which supplements the federal EITC and is available to low- and moderate-income working families and individuals, is a refundable credit. The Vermont Child Tax Credit (CTC), which can be claimed for each child under 6, was adopted in 2022 and is also refundable.
3SquaresVT Assistance
3SquaresVT Assistance
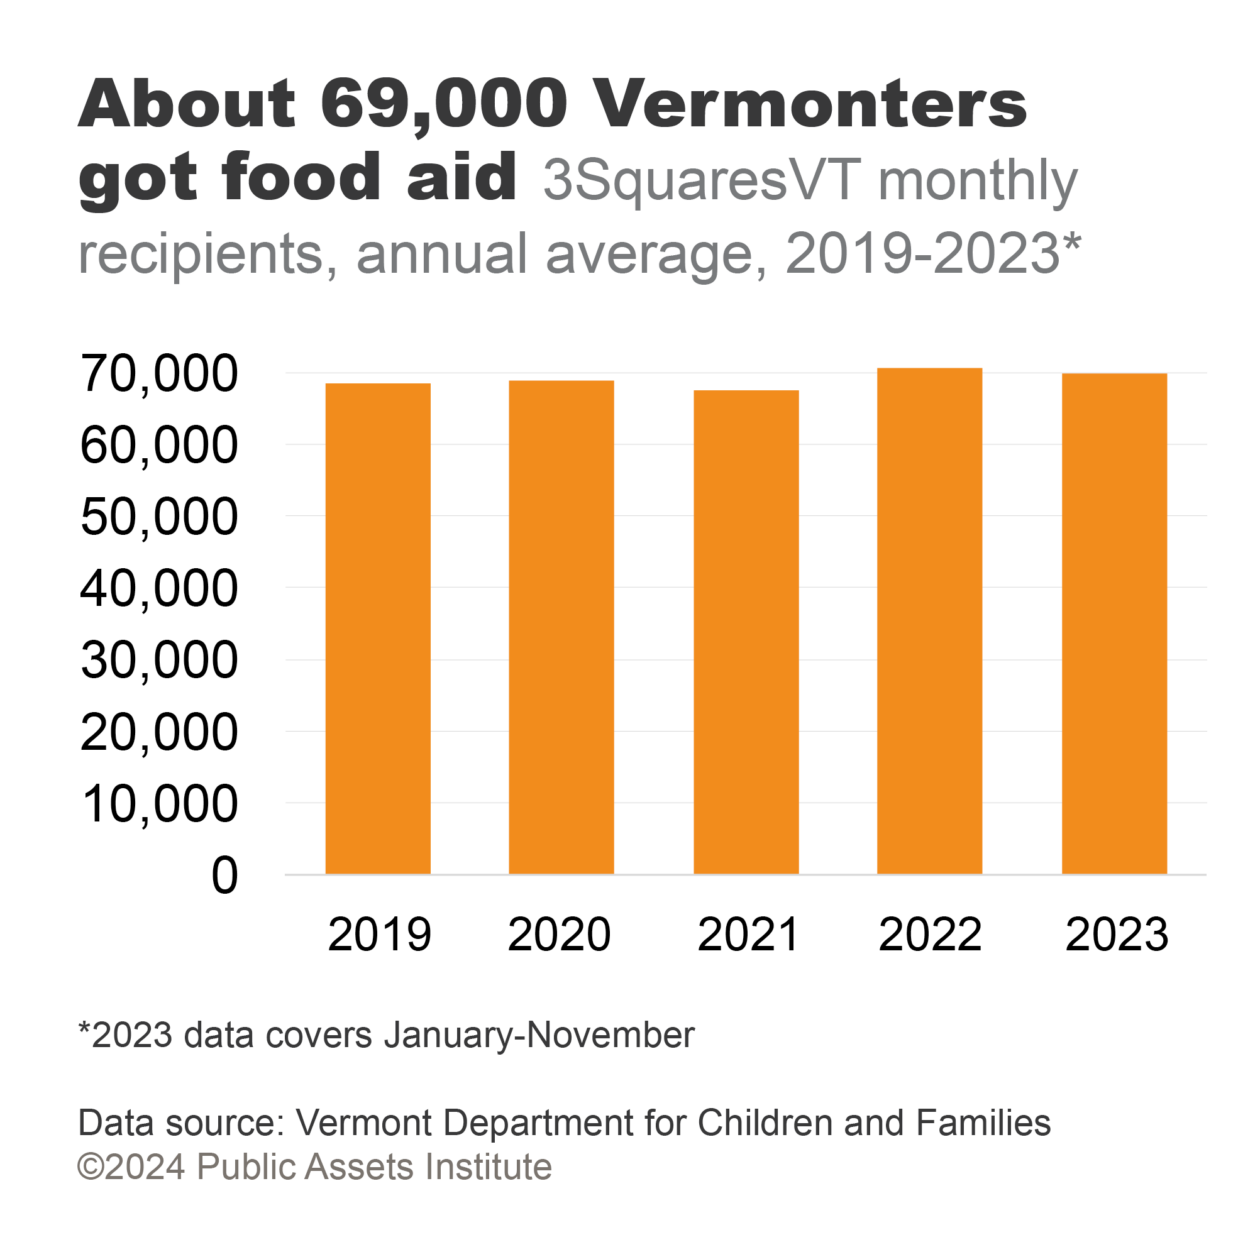
3SquaresVT provides food assistance to Vermonters with incomes up to 185 percent of federal poverty guidelines. Participants receive benefits through the federal Supplemental Nutrition Assistance Program (SNAP).
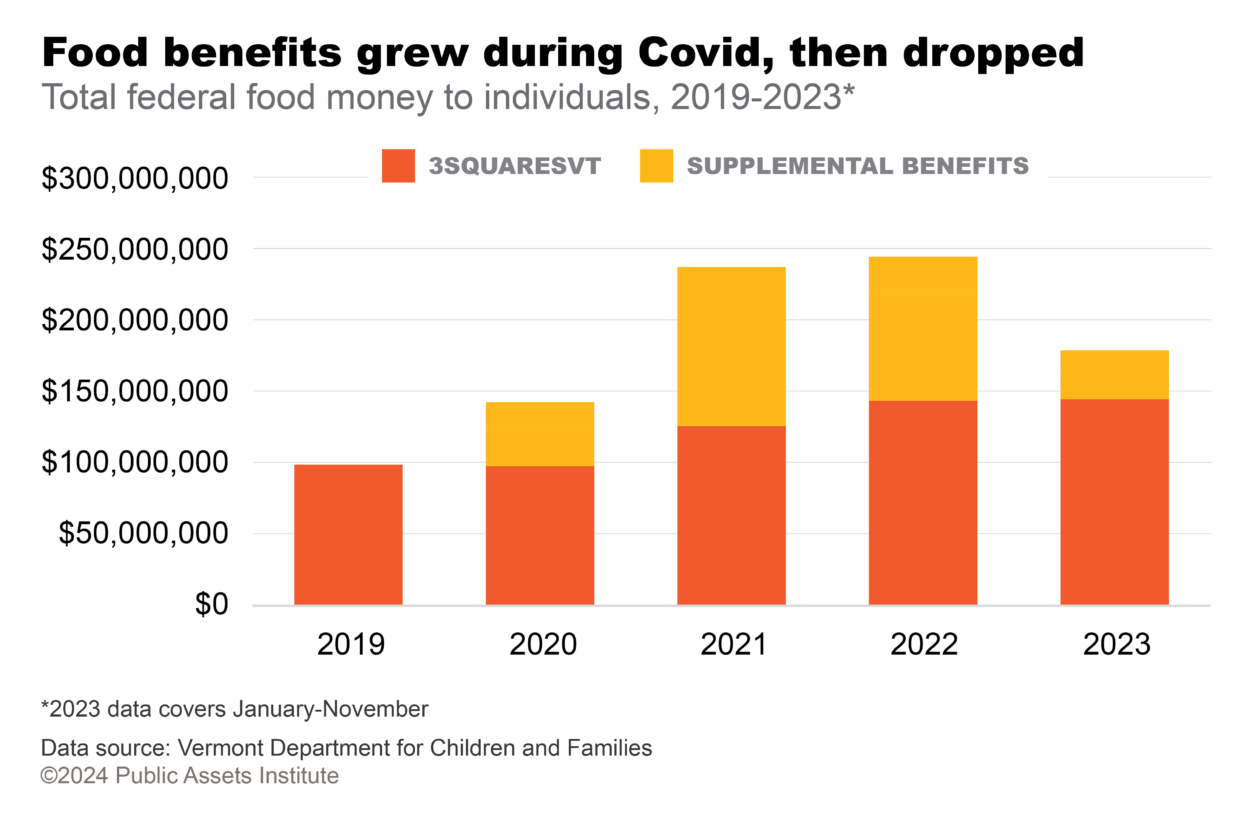
Federal cash assistance for food nearly doubled during the pandemic. The additional aid went to the 69,000 participants in 3SquaresVT—roughly one in 10 Vermonters—as well as to families with children in school that were not 3SquaresVt participants. The supplemental pandemic aid was temporary and ended in 2023. However, in October 2021, regular 3SquaresVT benefits increased to reflect revised national nutrition standards. Even with the increase, the maximum 3SquaresVT benefit set by the USDA for a family of four in 2024 is about $3,000 less than the annual cost of food calculated for that family in Vermont’s Basic Needs Budgets.4
Challenges
Some problems that Vermont faced before the pandemic persisted in 2022 and 2023:
- Poverty came down, but almost 50,000 Vermonters were trying to survive below the poverty level after the pandemic started to subside.
- The state’s rate of homelessness was the second highest in the country in 2023.
- Families still struggled to make ends meet, especially those led by single parents.
Some problems got worse during the pandemic, like the shortage of childcare slots.
Basic Needs
Basic Needs
Basic needs are the essential requirements of living in Vermont, including food, housing, transportation, childcare, clothing, household expenses, telecommunications charges, health and dental care, insurance, and savings. Vermont’s Legislative Joint Fiscal Office calculates Basic Needs Budgets for six family configurations and publishes them in January of odd-numbered years. Budgets differ based on family size and residence in an urban or rural area.
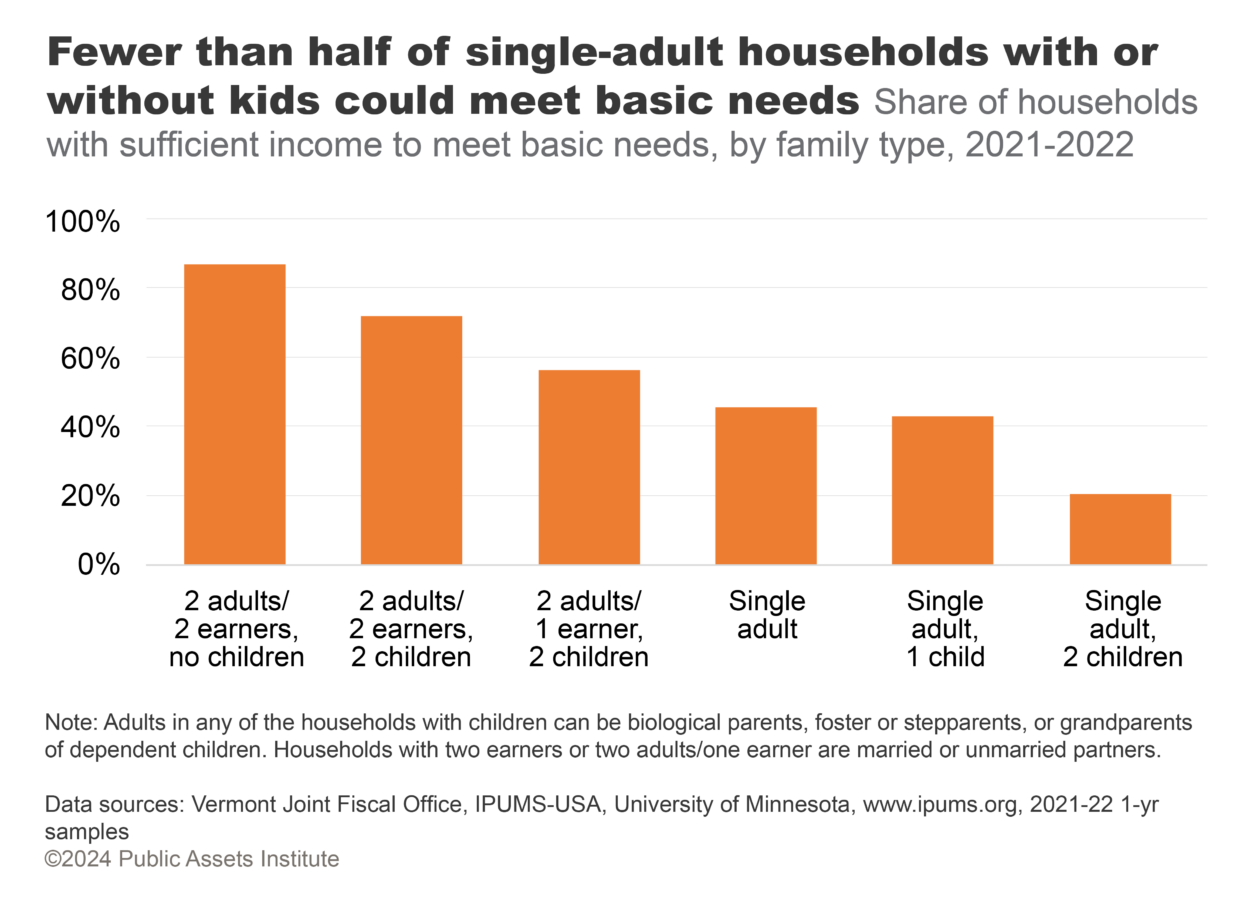
Most two-earner households were able to meet their basic needs in 2021 and 2022—87 percent of those without children and more than 70 percent of those with two children had enough income. In contrast, fewer than half of single-adult households met the threshold, and just 20 percent of single adults with two children did.
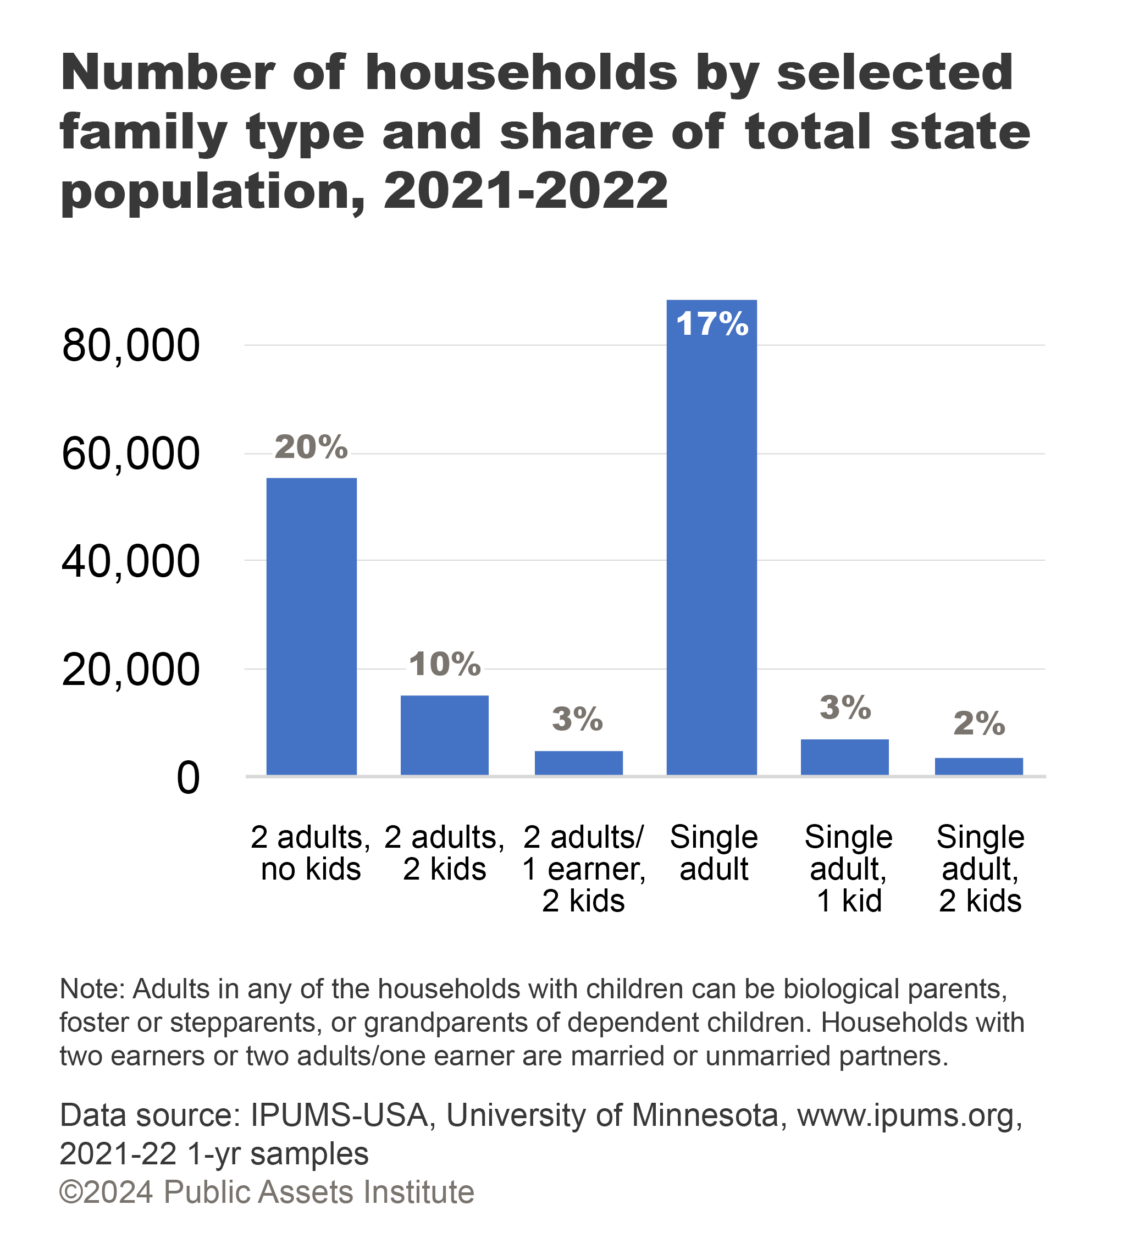
While this analysis does not cover all families in Vermont, income data were available for six family types representing about two-thirds of Vermont’s households and about 55 percent of its population. The analysis does not factor in direct pandemic relief such as tax credits and stimulus payments either.
Childcare Capacity
Childcare Capacity
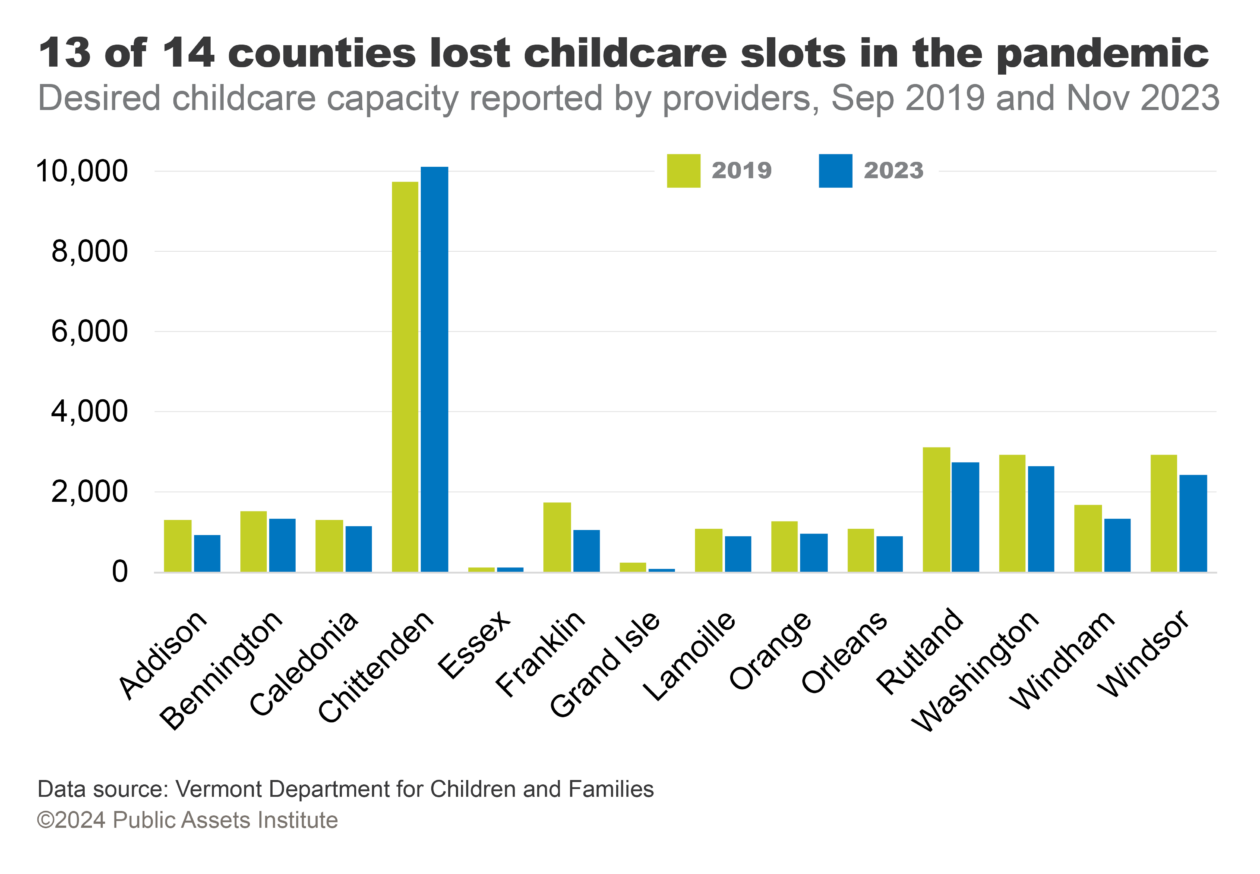
Childcare capacity is the number of slots licensed providers and registered homes have available for infants, toddlers, preschoolers, and school-age children, as reported to the Department for Children and Families. Desired capacity differs from the licensed capacity set by the state and more accurately reflects the number of children that childcare facilities can accommodate.
The pandemic took a toll on childcare in Vermont. In November 2023, there were 182 fewer active childcare providers than four years earlier, a decrease of more than 16 percent. Between the loss of providers and a decline in slots among remaining providers, the state reported about 3,315 fewer slots, a drop of 11 percent. The decrease was seen across the state, except in Chittenden County, where capacity increased about 4 percent, or just over 400 slots.
Poverty by Race
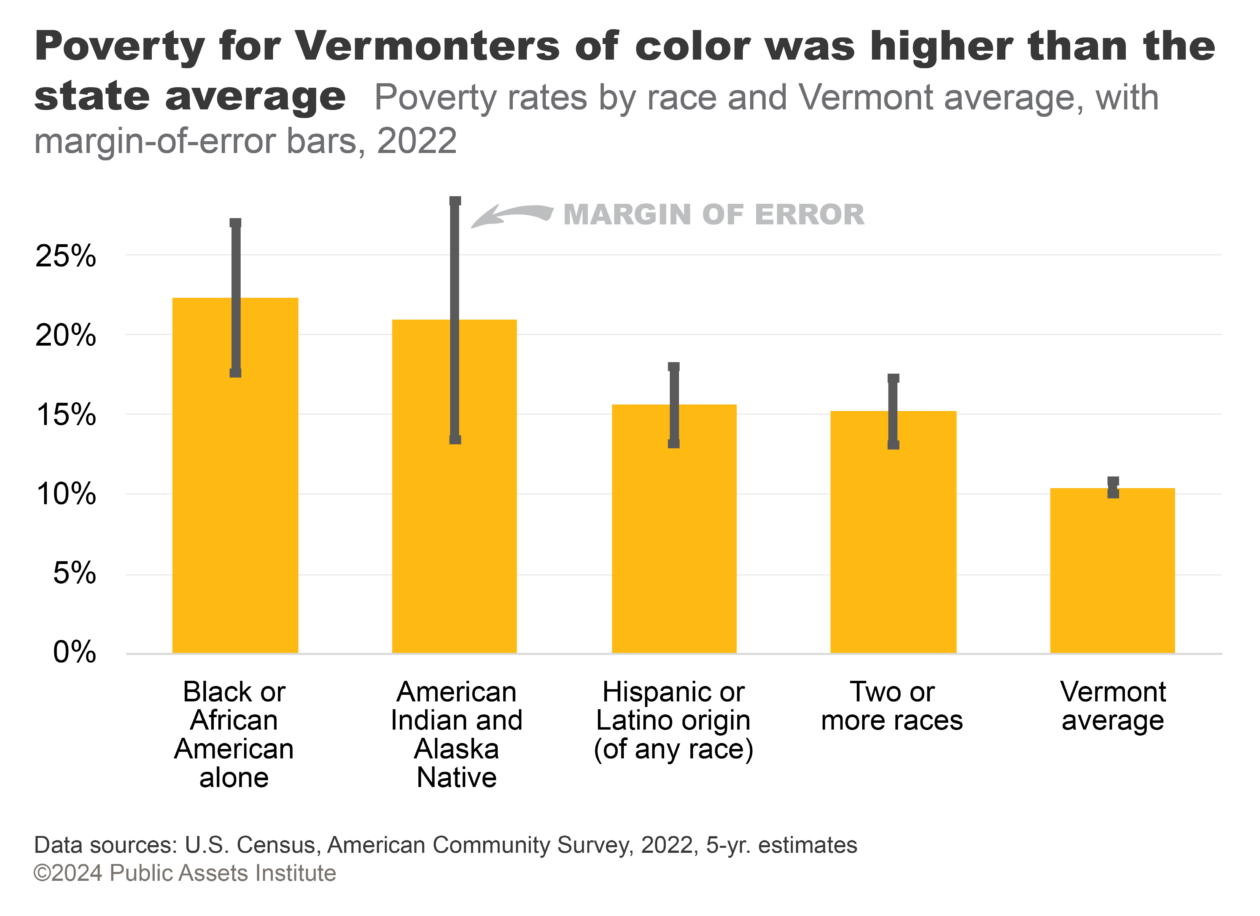
Black and Indigenous Vermonters experienced poverty at more than twice the state’s average rate—22.3 and 20.9 percent respectively, versus 10.4 percent. Poverty rates among people who included themselves in two or more racial groups or identified as Hispanic or Latino were also higher than the state average.
Vermont’s population was the least diverse in the nation in 2022. Given the relatively small number of Vermonters of color, poverty estimates are not as precise for these groups as they are for the state average. But people of color continue to experience poverty at higher rates even at the lowest ends of the margins of error.
Poverty by Race
The U.S. Census tracks poverty by many demographics, including race. Because the number of Vermonters of color is relatively small, five-year estimates—based on surveys collected over five years and therefore representing a larger population sample—provide a more reliable picture of the differences. Nevertheless, some of the estimates have large margins of error.
Homelessness
Homelessness
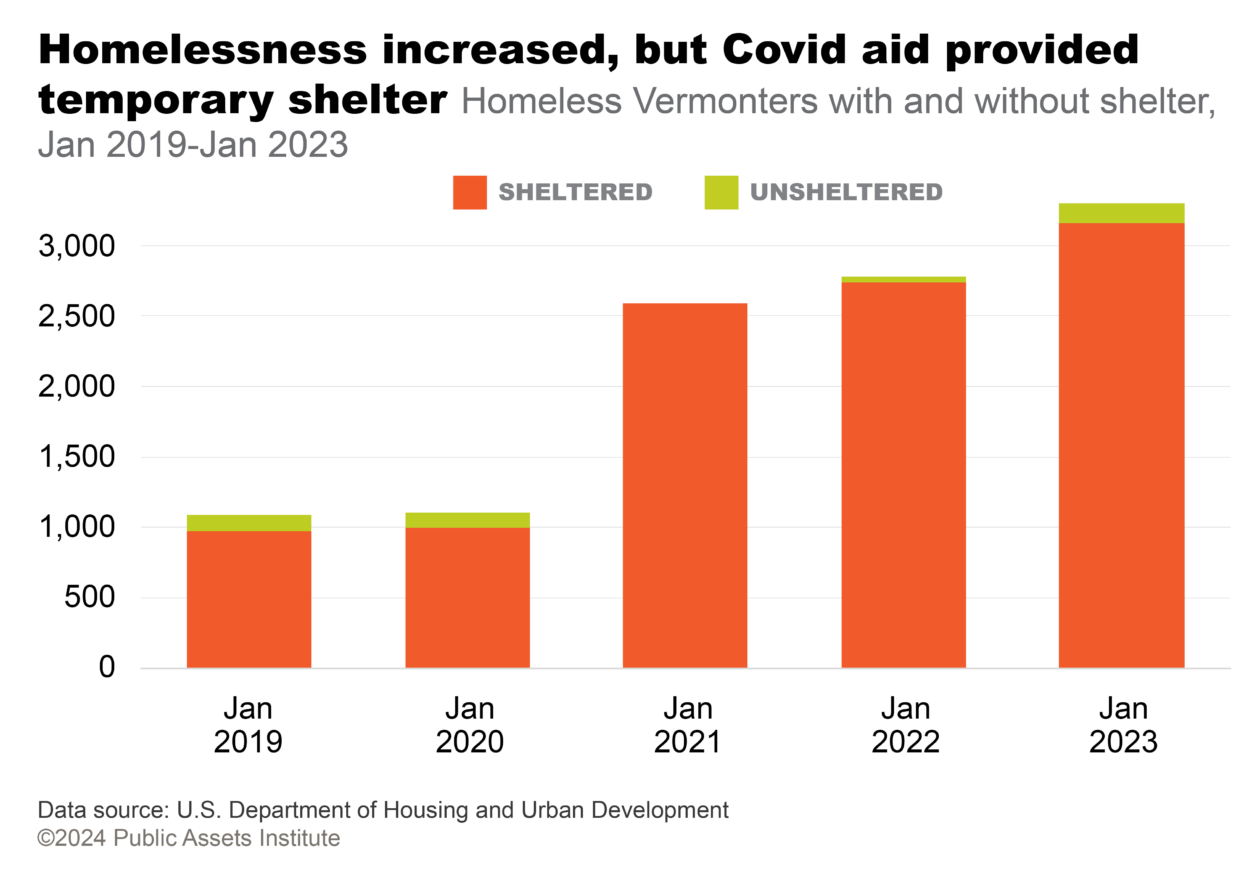
The point-in-time homeless count is a measure of the number of people living in emergency shelters, hotels, transitional housing, and places not meant for human habitation. It does not include households doubled up with family or friends. The figure is based on a census taken each year in one 24-hour period in January. Vermont housing organizations conduct the survey using methods established by the U.S. Department of Housing and Urban Development.
Almost 3,330 Vermonters were homeless in 2023, according to the annual count done in January for the U.S. Department of Housing and Urban Development (HUD). As a percentage of the population, Vermont had the second-highest rate of homelessness in the country. Thanks to federal pandemic-era aid to the states, 96 percent of people in Vermont experiencing homelessness were provided temporary shelter, the highest percentage among the states. However, on June 1, 2023, as federal aid winded down, Vermont evicted nearly 800 people from emergency shelter.5 According to HUD, the number of homeless Vermont families with children rose more than 200 percent in the wake of the Covid pandemic, from 372 in 2020 to 1,166 in 2023. That was the biggest increase for families with children among the states. The state continues to grapple with Vermonters’ needs for both temporary and permanent housing.
Covid Hospitalizations
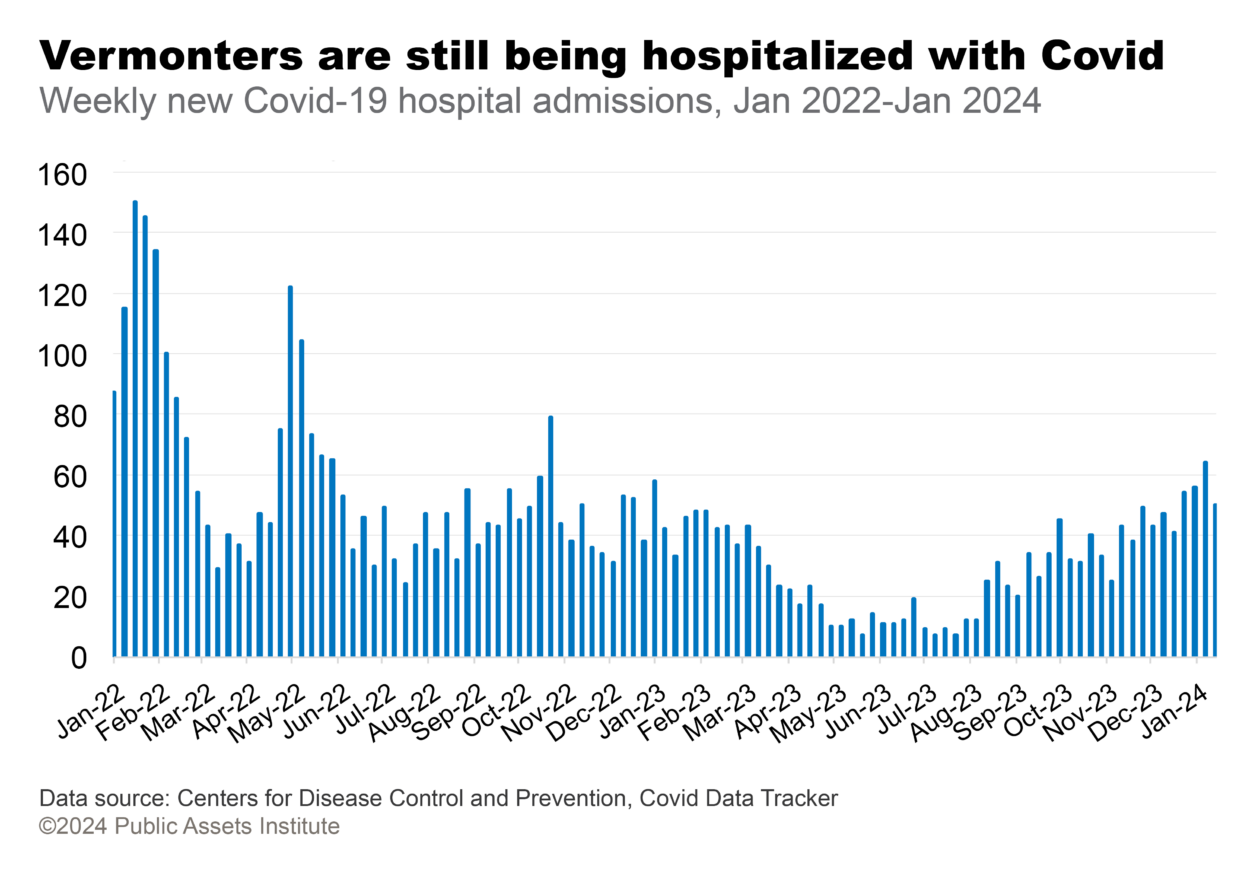
At the end of 2023 and into 2024, the Vermont Health Department rated Vermont’s hospitalization level as low. Data from the Centers for Disease Control and Prevention show that the seasonal spikes in new hospital admissions due to Covid declined in Vermont from the start of 2022 through summer 2023. In mid-January 2024, Vermont reported new weekly Covid hospital admissions of 8.0 per 100,000 people, which was the 13th-lowest rate among the states for new admissions that week. U.S. hospitalizations numbered 9.9 per 100,000 during the same week.
Covid Hospitalizations
Hospitalization data now provide the best measure of Covid-19’s effect on communities, according to the Vermont Health Department. Measuring hospitalizations per 100,000 residents allows Vermont to compare itself with other states.
Capacity for Investment
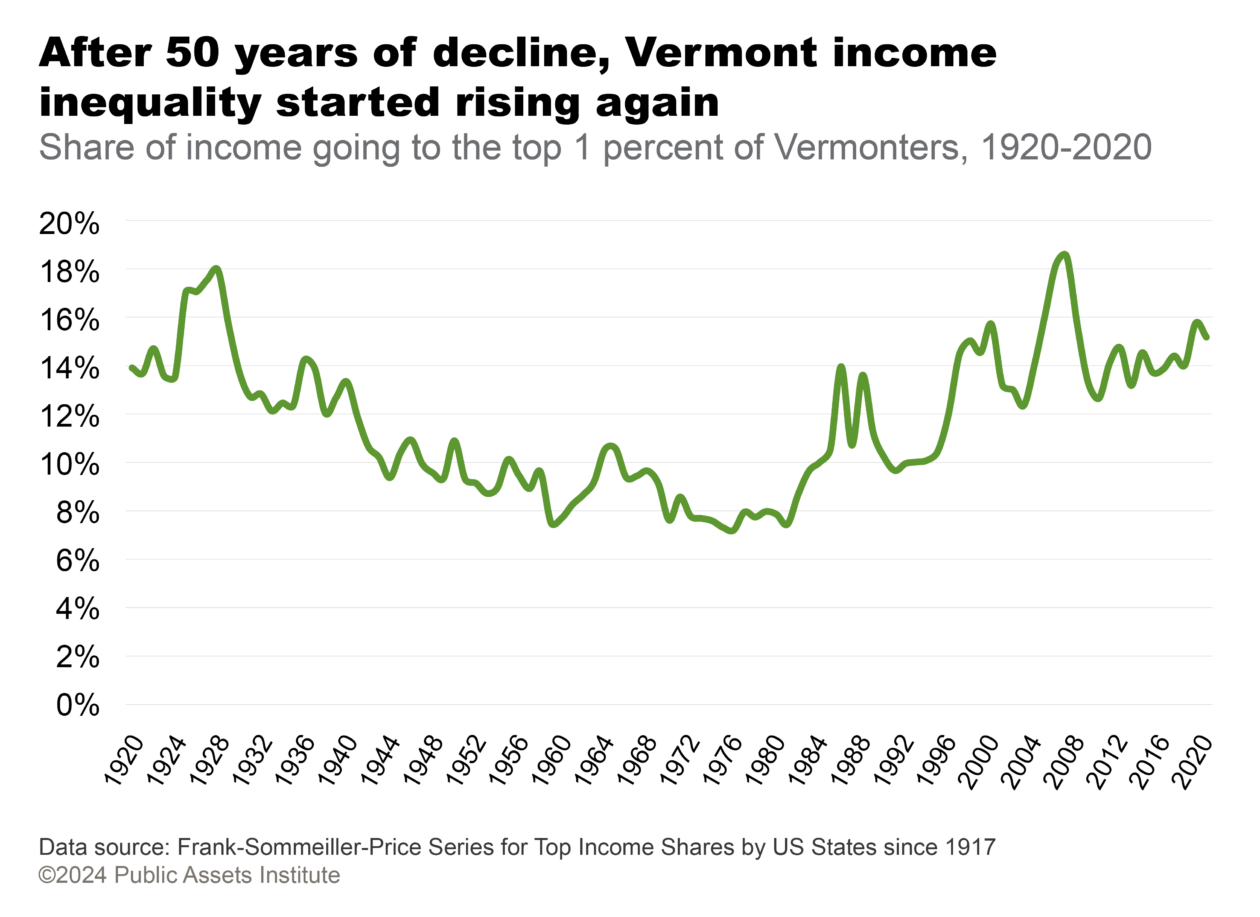
The share of income going to the top 1 percent of Vermonters has increased steadily for more than 40 years, creating income inequality that the state hasn’t seen in generations.
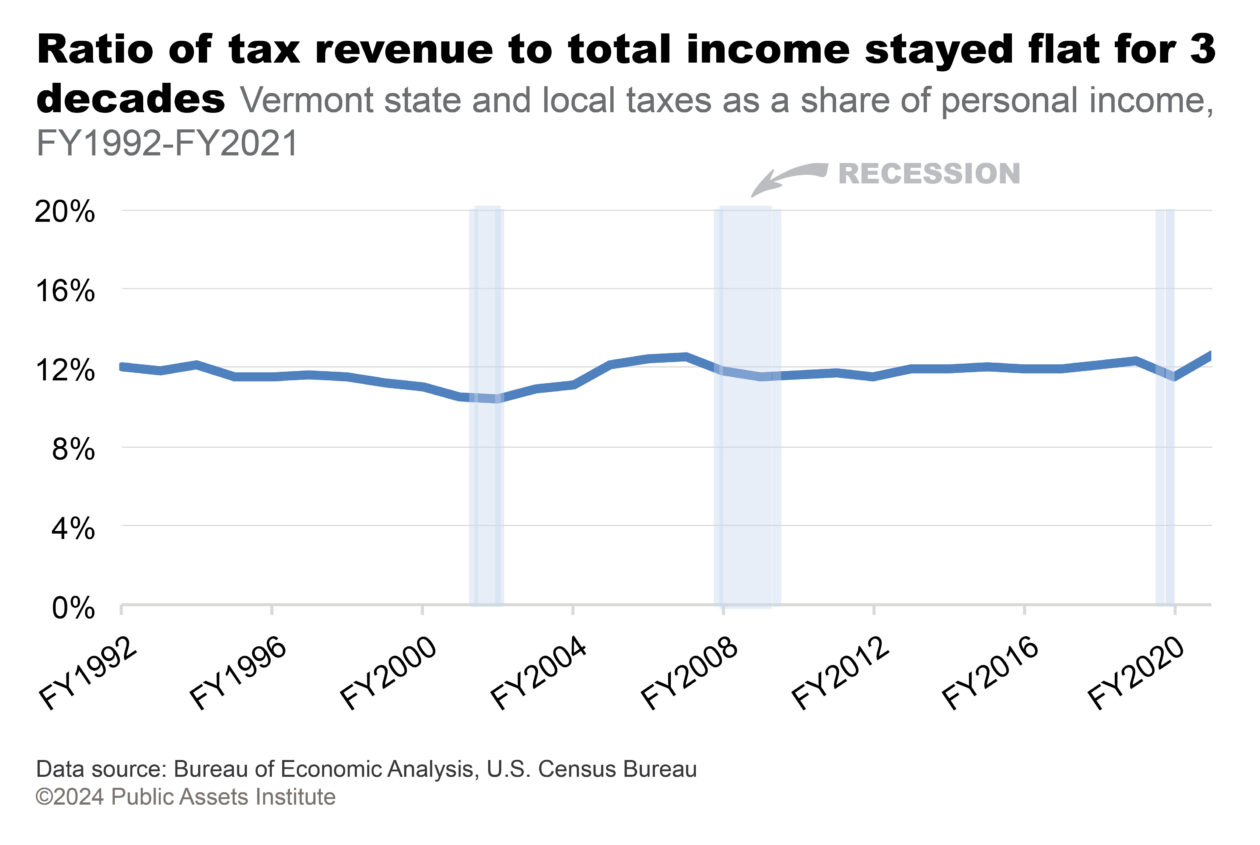
State and local taxes have amounted to about the same percentage of Vermonters’ incomes for more than three decades. This is despite new challenges such as climate-related disasters that demand far greater revenue than the state needed in the past.
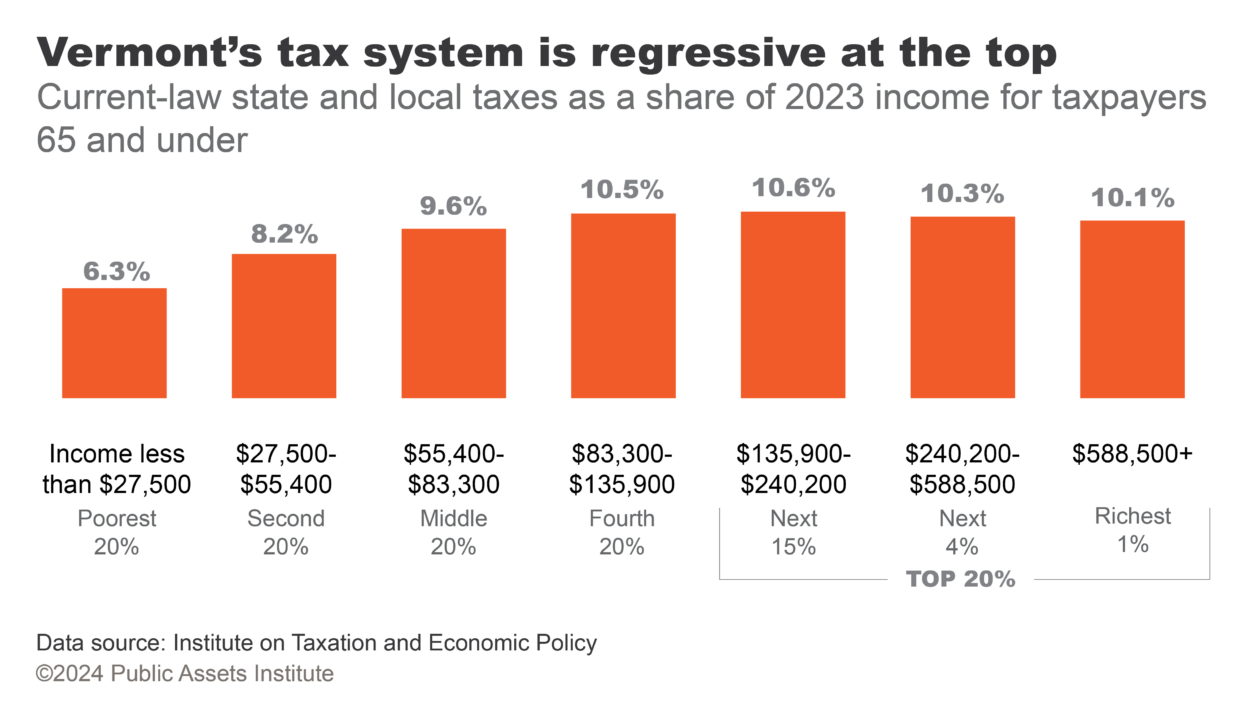
Vermont’s tax system remains regressive at the top, although it is one of the least regressive in the U.S. The state’s top 5 percent pay a smaller share of their income in taxes than their lower-income counterparts.
It is a state responsibility to ensure that everyone who lives in Vermont has enough to feel secure in their housing, food, healthcare, and transportation. It is the role of the state to maintain and improve roads and bridges, to clean up and protect rivers and lakes, to give all our children the best education, to care for our sick and elderly, and to promote racial and social equity.
Policymakers should raise needed revenue fairly and spend it wisely for the benefit of all the people who live in Vermont.
Vermont has the capacity to address its current challenges and invest for a better future.
Income Inequality
Within the past century Vermont, along with the rest of the country, has seen periods of high income inequality like those we’re experiencing today. In other periods, progressive taxation, strong labor unions, and government action reversed the concentration of income and wealth and narrowed the wage gap between the highest and lowest earners.
After the Great Depression of the 1930s and through the 1970s, income inequality declined steadily in the U.S. and Vermont. That trend ended around 1980, due to changes in economic policies and corporate practices, and the gap between households with the highest incomes and everybody else widened again. The share of income going to the top 1 percent of Vermont taxpayers came to 15.2 percent in 2020—more than double the share in 1981. Research has shown that the concentration of income at the top hurts middle-income families.6
Income Inequality
Income inequality is an economic situation in which a small group receives a disproportionate share of the income, leaving less for everyone else. It is one indication of how economic growth is being distributed across a population. The analysis of income distribution is based on Internal Revenue Service data.
Income of top 1%
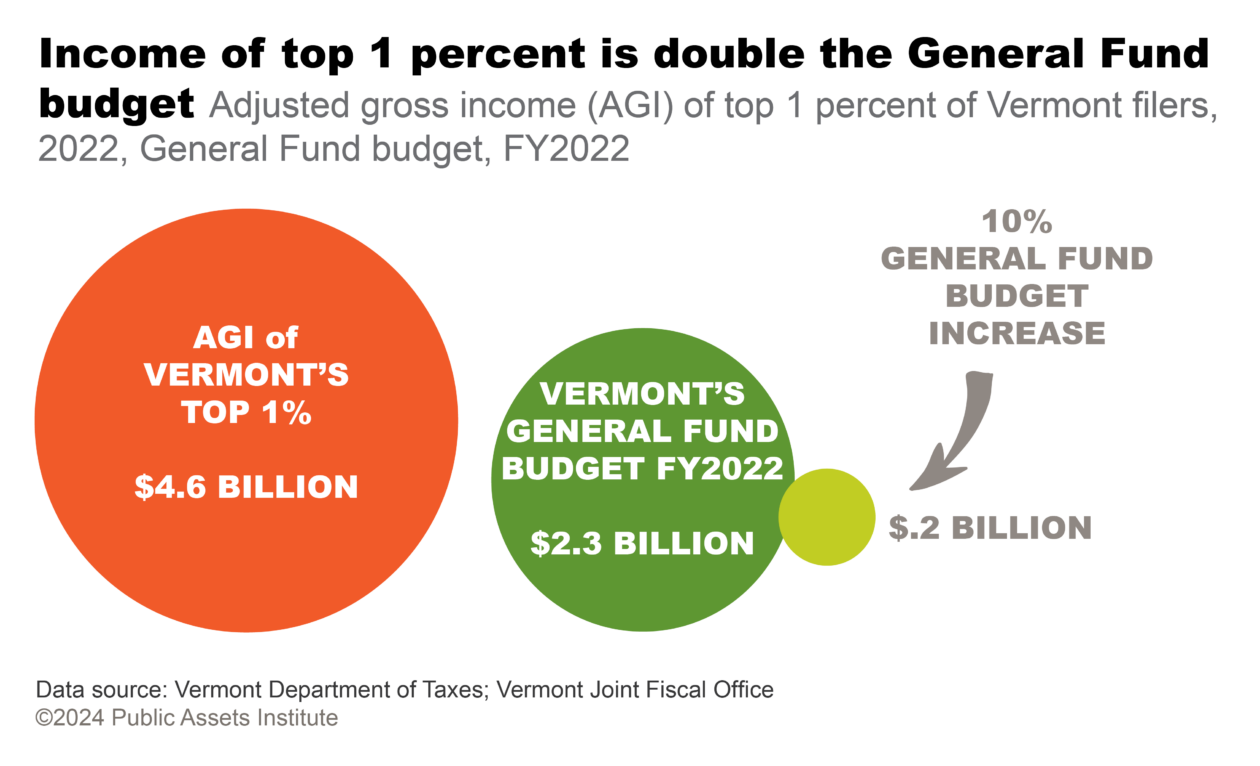
The top 1 percent had adjusted gross income (AGI) of $4.6 billion in 2022. The state General Fund budget was about half that—$2.3 billion in fiscal 2022. The top 1 percent included 3,281 filers with AGI of $520,500 and higher. The average income for this group of filers was about $1.4 million—nearly 20 times Vermont’s median household income.
Not only has this group’s share of total income been increasing for decades, but federal tax cuts over the last 40 years have also disproportionately benefited the rich. The federal Tax Cuts and Jobs Act of 2017, a law that is still in effect, has yielded hundreds of millions of dollars for the top 1 percent of Vermonters since its passage. A 5 percent surcharge on the income of this group would yield $230 million for additional public investment in Vermont—about 10 percent of General Fund spending.
State and Local Taxes as a Percentage of Personal Income
State and local taxes as a percentage of total personal income—a broad measure of public investment—has moved little in decades. It has hovered around 12 percent since the early 1990s. This reflects policymakers’ “manage to the money” approach, a passive policy that limits spending for state services to whatever revenue existing tax rates generate in a given year.
Managing to the money produces constancy, but it does not allow the state to respond with additional resources when they’re needed. Over that same 30-year period, the state faced worsening crises in health care, including mental health, water quality, housing, and education, as well as emergent problems such as more frequent floods. The revenue those tax levels yielded has become less and less adequate to meet Vermont’s challenges.
The state’s increasing income inequality shows that some Vermonters have a greater ability to contribute additional taxes than others. Any tax increase should take fairness among taxpayers into consideration.
State and Local Taxes as a Percentage of Personal Income
State and local taxes comprise all taxes levied by Vermont’s state and local government entities to fund public investments.
Personal income is a major economic indicator. It includes total income received by persons living in Vermont from all sources except capital gains.
Tax Progressivity
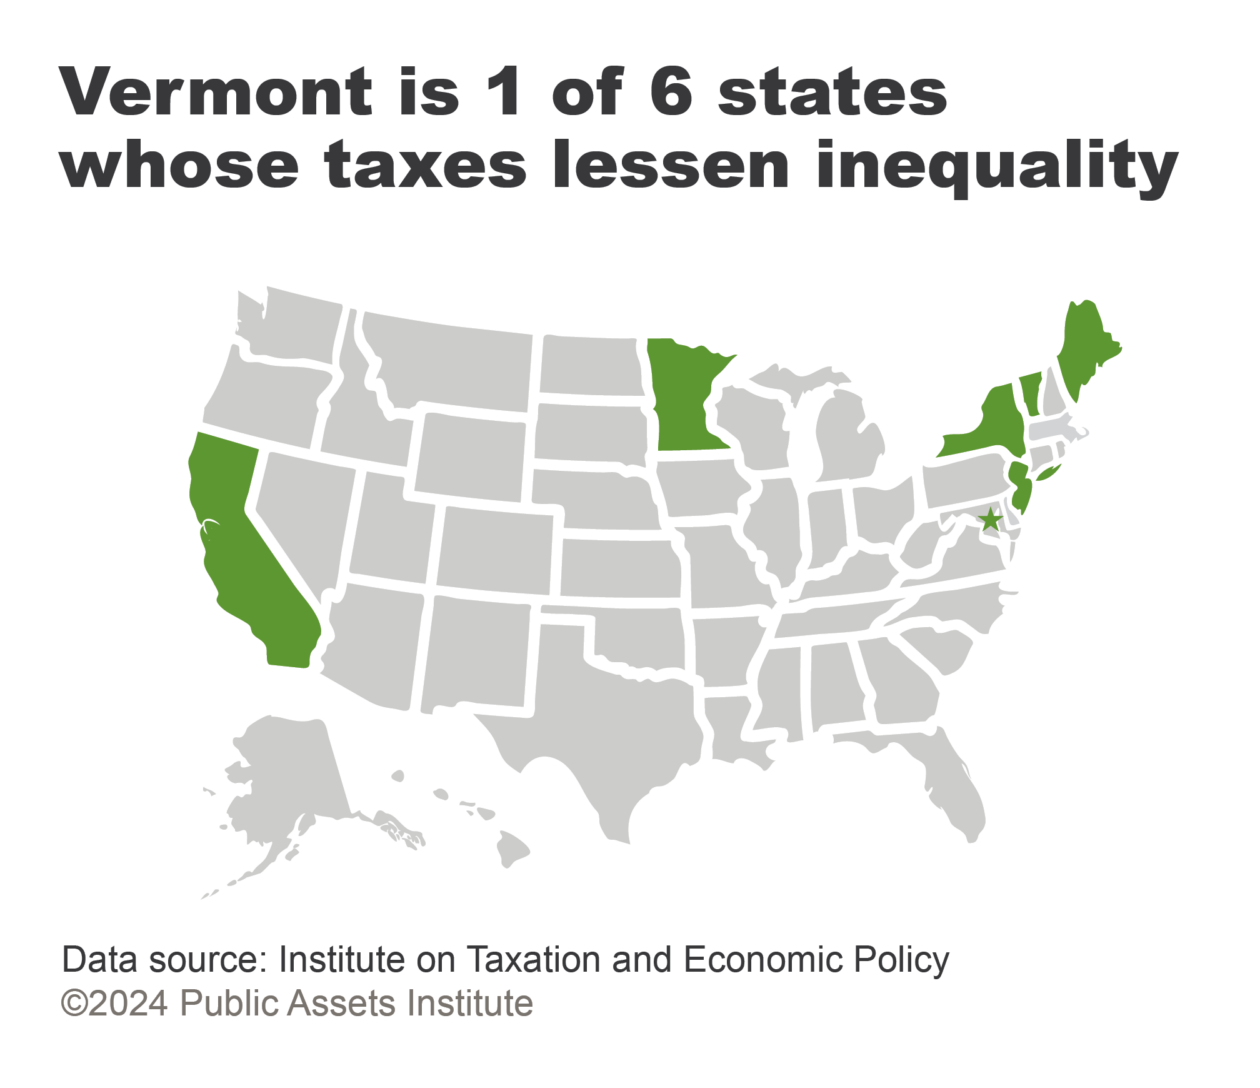
While still not totally progressive, Vermont’s tax system is less regressive than it was five years ago and less regressive than most other states’ systems. Vermont was one of six states, including Minnesota, New York, New Jersey, Maine, and California, plus the District of Columbia, whose tax systems lessen income inequality.7 In most states, low- and moderate-income people pay a larger share of their income in taxes than do the top 1 percent of taxpayers. In recent years Vermont has increased progressivity by curbing some tax breaks that favor people with higher incomes and instituting tax credits for lower-income residents.
Tax Progressivity
Progressive tax systems impose higher rates on those with more income and lower rates on those with less income. Regressive systems tax the poor more heavily than the rich. Vermont has adopted various mechanisms to make its systems more progressive: an income tax with higher rates on higher income; sales tax exemptions on necessities that take a bigger bite of smaller earnings, such as food and medicine; and school taxes based not on property value but on income, which better conforms with ability to pay.
- 32 V.S.A. § 306a. Purpose of the State Budget [↩]
- Medical expenses, after premiums, of 10 percent or more of household income for households with income equal to or greater than 200 percent of the federal poverty level; expenses greater than 5 percent of household income for households below 200 percent of the federal poverty level; or deductibles equal to or greater than 5 percent of household income. [↩]
- Center on Budget and Policy Priorities, https://www.cbpp.org/research/eitc-and-child-tax-credit-promote-work-reduce-poverty-and-support-childrens-development [↩]
- 3SquaresVT benefits are based on the USDA’s Thrifty Food Plan. Vermont’s Joint Fiscal Office uses the USDA’s Moderate Food Plan in determining the state’s Basic Needs Budgets. [↩]
- https://vtdigger.org/2023/06/01/after-last-ditch-legal-effort-fails-hundreds-of-unhoused-vermonters-are-evicted-from-motel-program/ [↩]
- Jeffrey P. Thompson and Elias Leight, “Do Rising Top Income Shares Affect the Incomes or Earnings of Low and Middle-Income Families?” (Washington: Federal Reserve Board, 2012). [↩]
- Institute on Taxation and Economic Policy, “Who Pays? A Distributional Analysis of the Tax Systems in All 50 States” (2024), 14, https://itep.org/whopays/ [↩]
State of Working Vermont 2023 was created in conjunction with the Economic Policy Institute in Washington D.C. and was funded in part by the Annie E. Casey Foundation and the J. Warren and Lois McClure Foundation, a supporting organization of the Vermont Community Foundation. We thank them for their support but acknowledge that the findings presented in this report are those of the Public Assets Institute and do not necessarily reflect the opinions of our partners.
